



What to know:
- XRP breakout retest now keeps key macro support and long-term trend structure in focus.
- Daily EMA levels show price above the 20-day average but below the 50-day resistance.
- Total futures volume fell 25.51% as open interest declined to $2.50 billion, CoinGlass data shows.

XRP price analysis for Thursday, July 23, 2026, centers on a macro breakout retest and support levels. It examines moving averages, Bollinger Bands, derivatives activity, and long-term targets as the token tests its breakout structure.
As of writing, XRP is currently trading at $1.13, showing a decline of 0.13% in a day. The trading volume has also gone down by 31.53% and is currently standing at $960.43 million. Over the last week, the coin price has increased by 2.54%, according to CoinMarketCap.
Also Read: Ethena Price Analysis: ENA Breakout Signals a Strong Move Toward $0.10

What $0.85 Support Means for XRP Price
Popular analyst Egrag Crypto highlighted that XRP has broken out of a multi-year symmetrical triangle pattern. The XRP price is now testing whether that breakout can hold.
He identified the $0.85-$0.88 level as the key support range. His technical view of the situation considers this move as the retest of a macro level.
This range includes the bottom side of the triangle, the White Bridge pattern, and the expected level for the breakout retest. Wick below this range would not necessarily mean the breakdown of this pattern. Sustained monthly closes below it would diminish the bullish scenario.
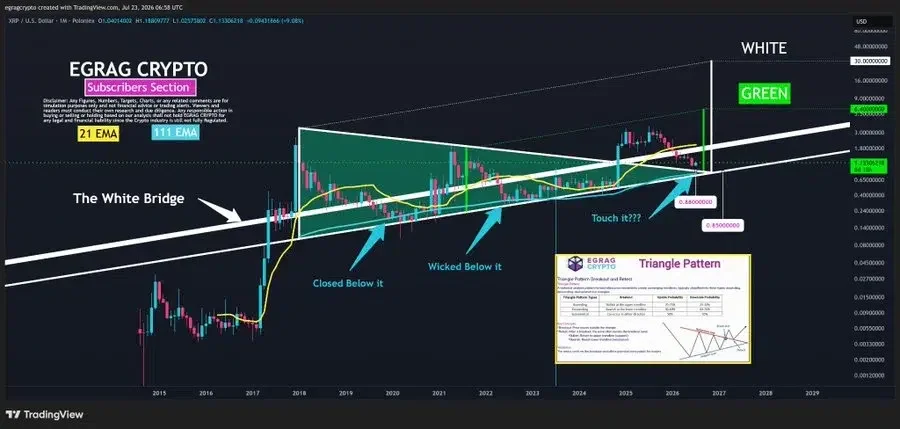

Egrag outlined a multi-step plan starting from the current levels. This scenario would include support at $0.85-$0.88, breakouts of $1.23 and $1.65, and the test of the $3.00-$3.50 zone. Then, higher levels could start to be relevant for the XRP price.
The analyst outlined the first measured-move target at $6.40. He considered $30 as the macro projection. That outcome would require acceptance above previous highs. His analysis did not present either level as an immediate target.
How EMA and Bollinger Bands Shape XRP Price
From a technical perspective, the 20-day EMA stood at $1.11130 on the daily chart. It means that the XRP price level is located above its closest short-term average. The 50-day EMA is even higher at $1.14479 and acted as immediate resistance.
The 100-day EMA is measured at $1.23336. The 200-day EMA is located higher at $1.43438. XRP price moved below both of them.
According to Bollinger Bands (BB) indicators, the middle band is at $1.11091. The upper band is set at $1.16209, while the lower band is measured at $1.05974.
The XRP price is situated above the middle band but below the upper band. It means that the volatility resistance could be seen at the level of $1.16209.
Why XRP Derivatives Activity Is Weakening
According to CoinGlass data, the future volume fell by 25.51% to $1.74 billion. Open interest also decreased by 1.42% to $2.50 billion.
The OI-weighted funding rate is standing at 0.0041%. The positive value indicated that the long position holders were paying short ones.
Liquidations reached $1.13 million within the past 24 hours. Long positions amounted to $570,500, while short positions totaled $557,610. The difference between the two totals is only $12,890.
Also Read: ADA Surges as Cardano Network Activity Explodes 4,457%, What’s Next?
This article contains market analysis and price predictions. These are not guarantees. Crypto markets are volatile. Always DYOR. Not financial advice.



Be the first to comment