


Shiba Inu is attempting to hold a breakout from the descending trendline that had capped its recovery attempts throughout July.
Key Takeaways
- SHIB has broken above the descending trendline that capped it since July 4 and is holding above it.
- The July 15 high near $0.00000435 is the first meaningful resistance test.
- Two equal lows at $0.00000405 form the floor of the structure and support both bullish and bearish readings.
- RSI has turned higher on bullish divergence, but volume has contracted for roughly three weeks.
SHIB traded near $0.0000042 on July 23, according to TradingView data from Coinbase, close to its lowest level on the daily chart since September 2021 and slightly above the former resistance line around $0.00000418. Holding this area could give buyers room to extend the rebound, although the move does not yet confirm a broader reversal.
Price remains below the 50-day, 100-day and 200-day simple moving averages, while volume has contracted for roughly three weeks. The setup is therefore conditional: holding the breakout could keep the recovery alive, but confirmation would require SHIB to move beyond the recent swing highs with stronger participation.
The Breakout Still Needs Follow-Through
The descending trendline had connected a series of lower highs since the July 4 local peak. Breaking above it interrupts that sequence and represents an early improvement in the short-term structure.
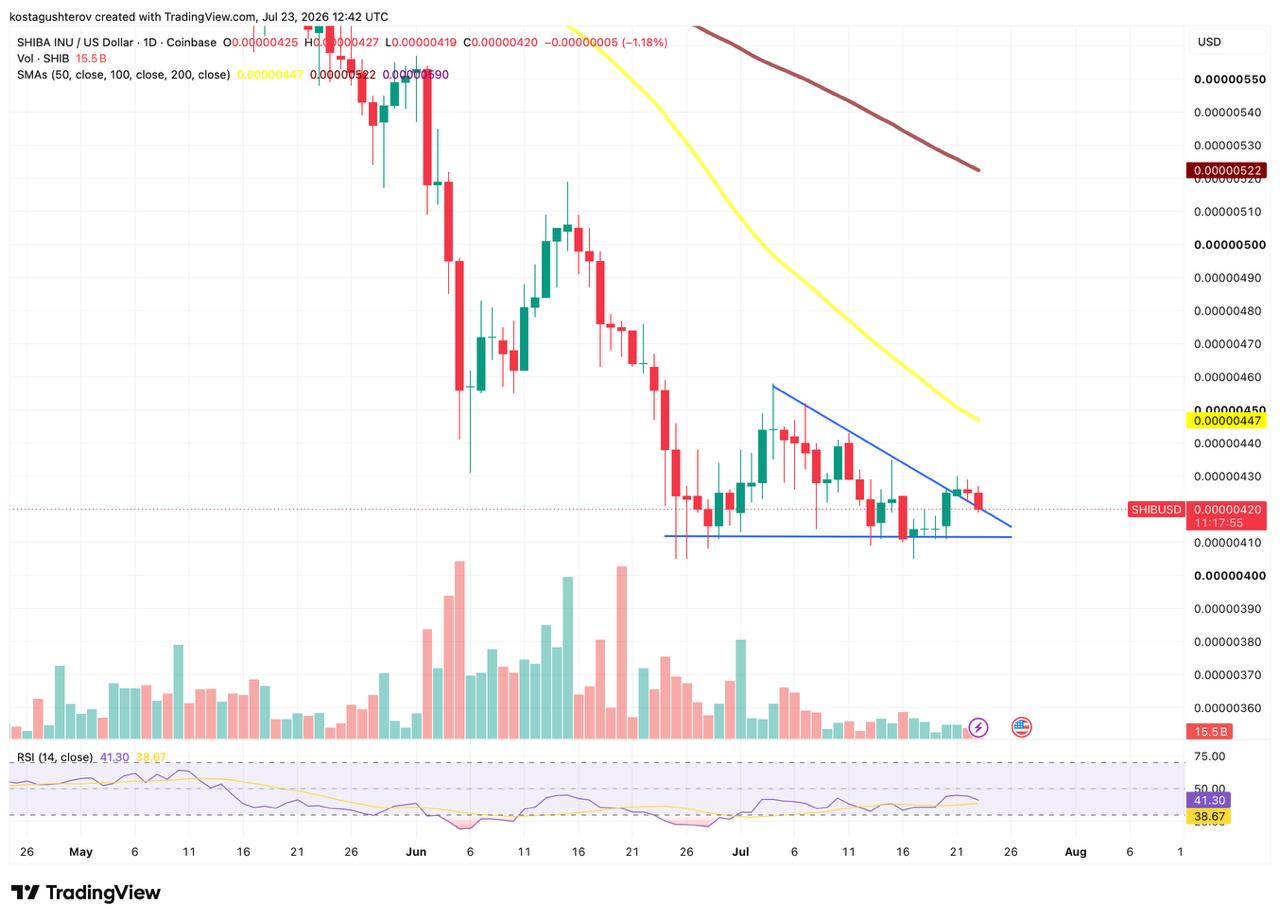
The next question is whether the former resistance can begin acting as support after a successful retest. As long as SHIB remains above approximately $0.00000418, the breakout could stay intact and allow another attempt at the July 15 high near $0.00000435.
A daily close back below the trendline would weaken that interpretation. Price could then return toward the nearby $0.00000411 shelf, where buyers recently attempted to stabilize the market.
Why $0.00000435 Is the First Important Test
The July 15 high near $0.00000435 matters more than the trendline because it represents the latest visible swing high.
A move above that area could suggest that SHIB is beginning to replace the recent pattern of lower highs with a more constructive short-term structure. It would also bring the falling 50-day simple moving average near $0.00000447 into focus.
The next resistance sits around $0.00000458, where the July 4 recovery stalled. That level is the one that decides how the current structure should be read.
Two Readings of the Same Two Lows
SHIB has tested the $0.00000405 region twice without establishing a lower low. Those reactions form the horizontal floor of the current structure, and they support two opposite interpretations.
Read as a double bottom, the equal lows mark a potential reversal pattern that would confirm on a break above the peak separating them, near $0.00000458. Read as a descending triangle, the same flat floor sits beneath a series of lower highs, a combination that more often resolves downward.
Both descriptions fit the chart as it stands, which is why neither should be treated as a forecast. The distinguishing level is the same either way: a daily close above $0.00000458 would favour the bullish reading, while a decisive break of $0.00000405 would resolve the bearish one. Until one of those happens, the structure is better described as a basing attempt than as a named pattern.
The repeated defense of $0.00000405 does suggest that selling pressure weakened near the chart low. It does not guarantee the floor will continue holding.
Momentum Is Improving, but Volume Is Missing
The relative strength index is near 42.5 and has started turning higher after forming a bullish divergence: while price returned to the same support area, RSI produced a stronger low. That could indicate bearish momentum was weakening during the second test of $0.00000405. The indicator also remains well below overbought territory, leaving room for momentum to improve if buying pressure increases.
Volume provides a less convincing signal. Trading activity has gradually declined during the formation of the current structure, and the trendline break has not been accompanied by any expansion in participation. Contracting volume is common while price compresses, but stronger activity would make a move through $0.00000435 more credible. Without it, SHIB could continue drifting around the breakout area without establishing a durable advance.
Where the Recovery Could Break Down
A daily close below $0.00000418 would place SHIB back under the broken trendline and raise the risk that the breakout was temporary.
The first downside reference would sit around $0.00000411. Holding that shelf could still leave room for another recovery attempt, although the technical setup would be weaker.
The more important level remains $0.00000405. A confirmed break below it would remove the equal lows and break the horizontal floor of the structure, resolving it in the direction of the broader downtrend and establishing a new yearly low.
Shibarium Developments Could Influence Attention
Price is also developing alongside continued work on Shibarium, the Shiba Inu ecosystem’s Ethereum layer-2 network.
The official Shibarium explorer shows more than 1.5 billion cumulative transactions. That figure measures total network activity, although it does not by itself indicate how much demand will reach SHIB or whether the activity is growing at the current stage.
The ecosystem is also working toward incorporating Fully Homomorphic Encryption, or FHE, into Shibarium. FHE is designed to allow calculations to be performed on encrypted data without first revealing the underlying information.
The official Shib.io roadmap includes an FHE-powered version of Shibarium, while its developer page says the integration is expected to use technology provided by Zama.
No specific activation date is listed on those pages. The development could attract more attention if a confirmed timetable or implementation update is released, but its effect on SHIB would depend on whether it translates into additional usage, demand or market participation.
The Larger Trend Remains Unresolved
The trendline break has improved SHIB’s immediate setup, but the broader chart remains bearish. Price is still below all three major moving averages, reflecting the wider weakness that has left most Binance-listed altcoins below their 200-day averages for the longest period since 2022.
For now, SHIB has produced an early countertrend break, not a confirmed reversal. The next phase could depend on whether price can hold the former trendline, attract stronger volume and move beyond the recent highs.
Source review: Based on SHIB/USD daily chart data from TradingView (Coinbase), the official Shibarium block explorer and Shib.io project documentation, checked July 23, 2026.
This article is provided for informational purposes only and does not constitute financial or investment advice.

Alex is Editor-in-Chief of Coindoo and co-founder of Millennial Media Group, with nearly a decade of experience covering financial markets – crypto first, then everything else.
It started in 2016 with Bitcoin. Like most people at the time, he didn’t fully understand it – so he kept digging. Blockchain, tokenomics, the projects, the cycles. That curiosity never stopped, and eventually pulled him into traditional markets too: equities, commodities, macro. Not because he left crypto behind, but because you can’t properly understand one without the other.
What drives him is straightforward: he wants to know why something is happening, not just that it’s happening. Most market coverage stops at the headline – price up, price down, here’s a chart. Alex finds that kind of reporting actively unhelpful. If you walk away from an article without understanding the mechanism behind the move, what did you actually learn?
He holds a degree in Tourism from New Bulgarian University – not the most obvious path into financial markets, but markets have a way of pulling in people who are simply too curious to stay out. He has authored over 200 in-depth analyses and more than 10,000 articles across crypto and traditional finance. He still thinks every day in markets teaches him something new. That’s probably why he hasn’t stopped.


Be the first to comment