


What to know:
- EIGEN price forms a bullish falling wedge after completing its bearish target.
- Resistance targets are $0.343, $0.446, and $0.660 after a breakout.
- RSI and MACD indicate weakening bearish momentum with recovery potential.

The EIGEN price remains under long-term bearish pressure but is showing early signs of recovery after completing its projected downside move. A falling wedge pattern, stabilizing price action, and improving momentum indicators suggest a potential bullish reversal, provided key support levels hold and buying interest strengthens.
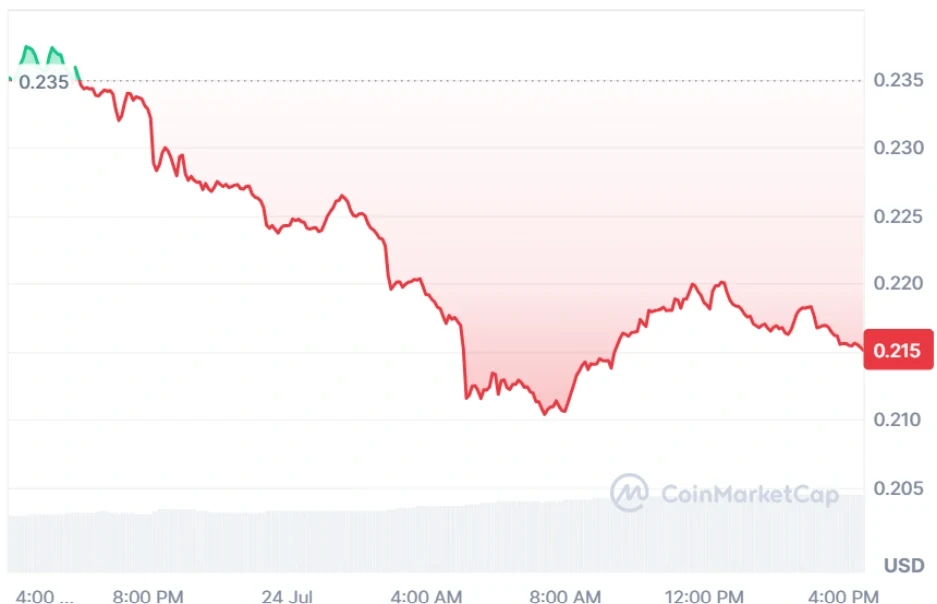
At the time of writing, EIGEN is trading at $0.2150, with a 24-hour trading volume of $16.04 million and a market capitalization of $188.1 million. Despite a 9.44% decline over the past 24 hours, EIGEN’s improving price structure suggests the potential for a bullish reversal in the sessions ahead.
Source: CoinMarketCap

Also Read: Whale Loses $5.89M on Eigenlayer (EIGEN) After Price Drops 64% in Two Months
EIGEN Price Builds Recovery Pattern After Long Decline
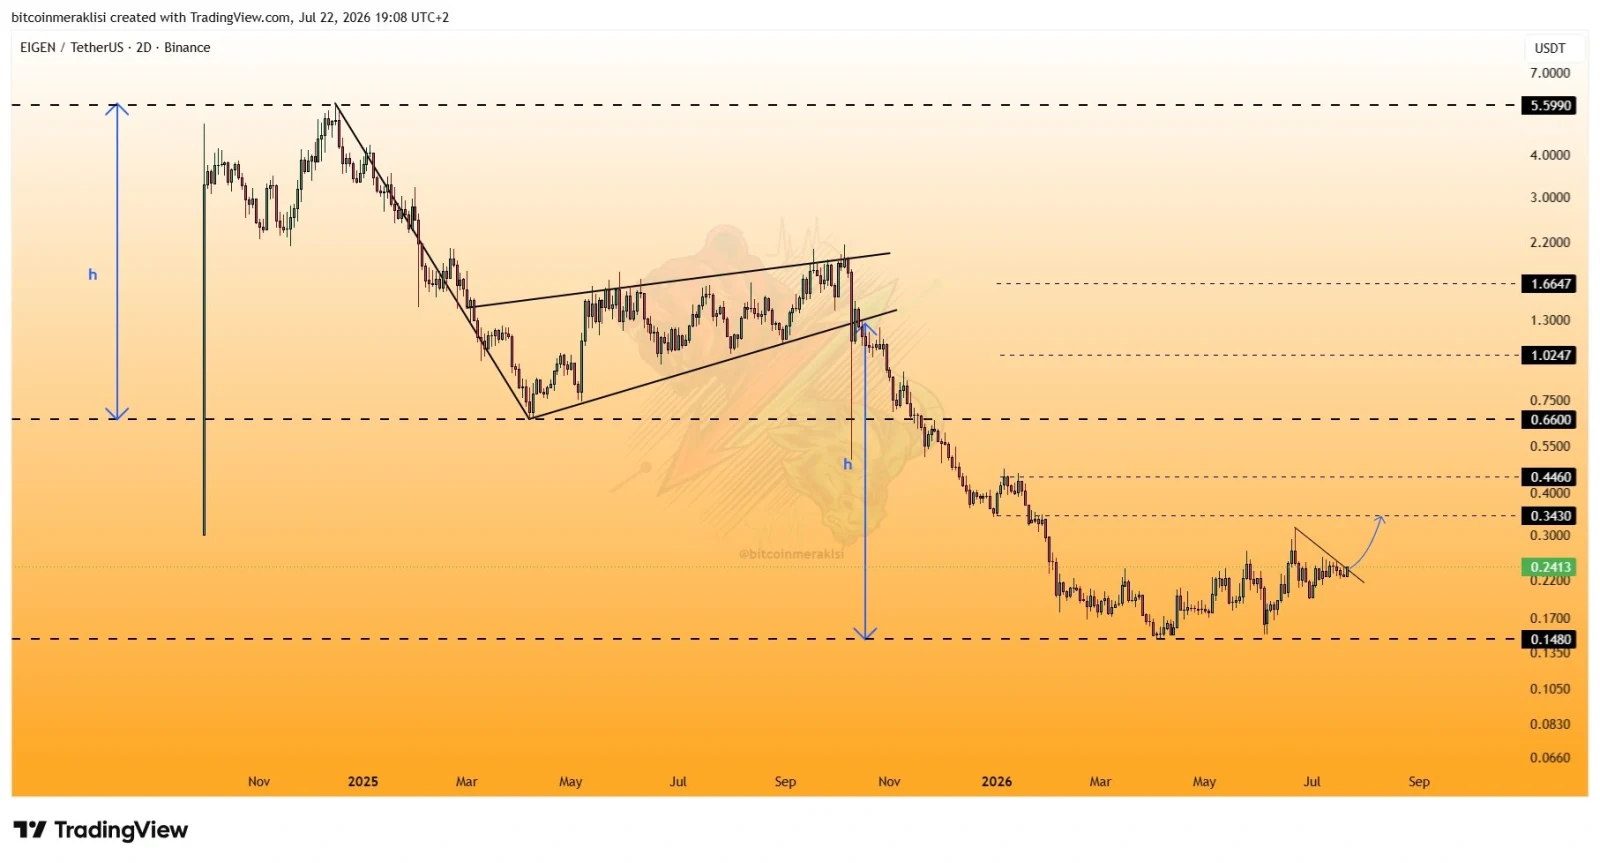
According to the crypto analyst Bitcoin Meraklisi, the EIGEN price remains in a broader downtrend after breaking below a rising channel, completing its measured bearish target near the $0.15 support zone. Since then, selling pressure has eased, with price stabilizing and forming a higher-low structure that hints at gradual accumulation.
The current price action is developing inside a small falling wedge, a pattern often associated with bullish reversals after extended declines.
A confirmed breakout above the wedge could drive EIGEN toward resistance levels at $0.343, $0.446, and eventually $0.660, according to the analyst Bitcoin Meraklısı.
Source: Bitcoin Meraklisi’s X Post
Despite the increasing strength, bulls need to protect the $0.22 and $0.15 support regions for a continued uptrend, while failure to do so will negate the bullish formation; continuous buying may encourage traders to believe that a trend change is underway.
RSI and MACD Show Mixed Momentum Signals
According to TradingView, the RSI (14) is placed at 48.75, with its signal line at 52.04. It implies that there is neutral momentum and a slight tendency to bearish movement. With the indicator below 50, it can be stated that buyers do not have total control. The price crossing 50 will shift the sentiment in favor of buyers.


Source: TradingView
When speaking about the MACD, one should note that the line is at 0.00212, the signal line at 0.00355, and the histogram at -0.00143. There is a bearish crossover, which indicates slowing upside momentum. At the same time, as the negative histogram decreases, the selling momentum fades away.
Despite the bullish price predictions, the EIGEN price is still moving in a downward direction, following technical indicators. This move is also impacted by the general trend in the crypto market as Bitcoin has started to move downward.
Also Read: XRP Price Surges as ETF Speculation and Political Support Grow
This article contains market analysis and price predictions. These are not guarantees. Crypto markets are volatile. Always DYOR. Not financial advice.



Be the first to comment