



Hyperliquid has returned to a level that could determine whether its broader recovery structure remains intact.
Key Takeaways
- HYPE has slipped below the 50% retracement of its spring advance.
- The token is testing its 100-day moving average near $56.7.
- Recovering $57.6 could support a rebound toward $62.
- A confirmed loss of the current support zone would expose $53.
- HYPE does not yet have enough trading history for a 200-day moving average.
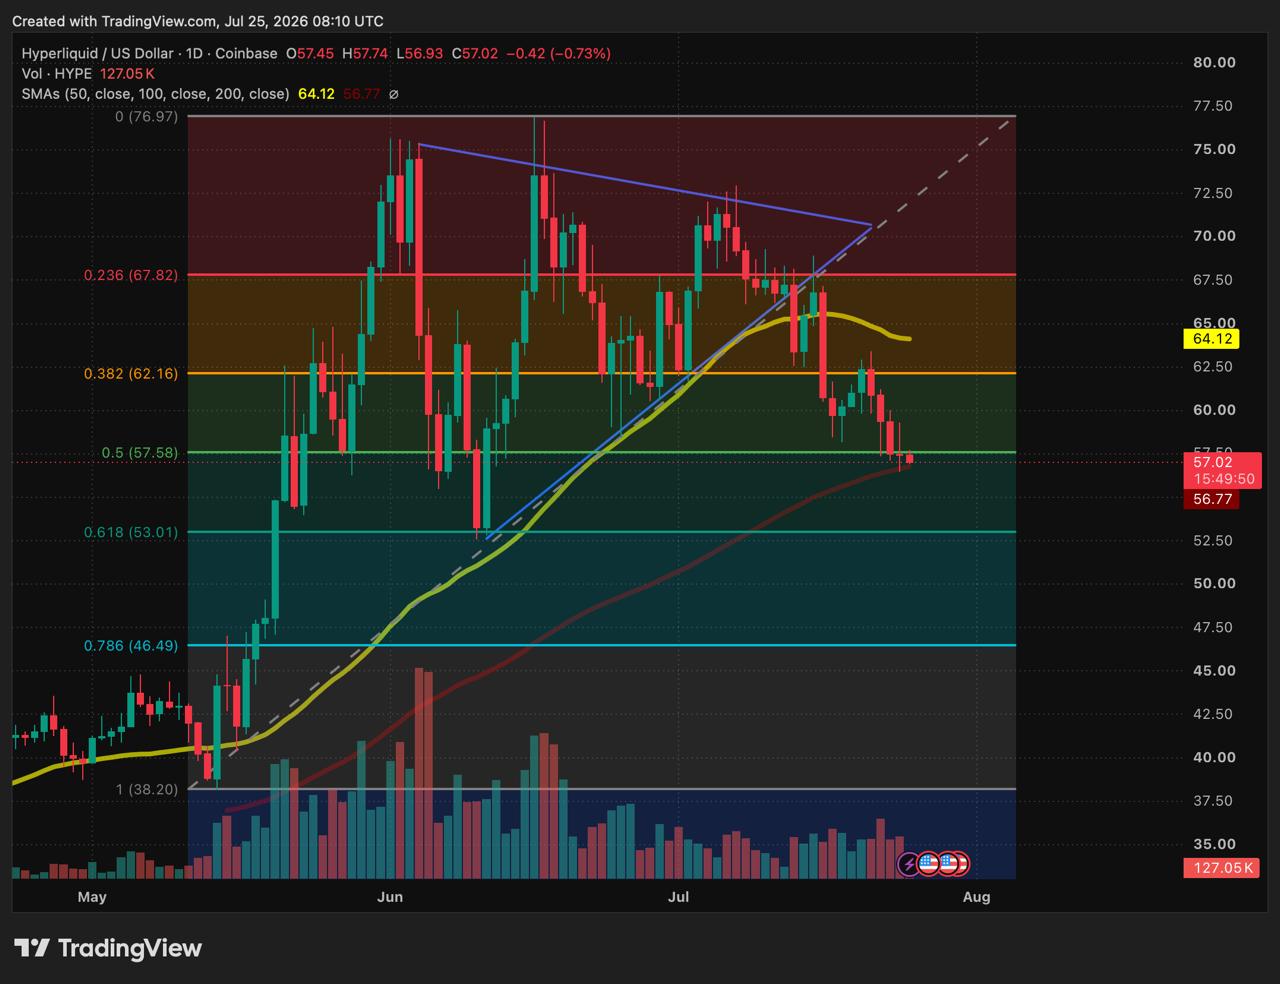
HYPE trades near $57 at the time of writing after slipping beneath the 0.5 Fibonacci retracement close to $57.6. That level marks the midpoint of the token’s advance from approximately $38 to $77.
The pullback has brought price directly to the 100-day simple moving average near $56.7. Together with the psychological $57 level, it forms the final visible support zone before the deeper 0.618 Fibonacci retracement near $53.
The 100-Day Average Is the Immediate Test
HYPE has already broken below the rising trendline that supported its advance from the June low. It also trades beneath the 50-day simple moving average near $64 and has formed a sequence of lower recovery highs since approaching $77.
The same support zone was already under pressure a day earlier, as ETF demand weakened while HYPE tested this crucial level.
The 100-day average is therefore the clearest remaining measure of medium-term support. An intraday move beneath it would carry less weight than a completed daily candle, particularly while price remains close to the 50% retracement.
A close back above the current support zone would show that buyers are still defending half of the spring rally. Acceptance below it would indicate that the correction is extending into a deeper part of the Fibonacci range.
A Recovery First Needs to Reclaim $57.6
The first sign of stabilisation would be a move back above the 0.5 retracement near $57.6.
If that level is recovered, the next resistance sits around $62, corresponding with the 0.382 retracement. This area previously acted as support and could now attract sellers looking to exit during a rebound.
Beyond $62, the falling 50-day average near $64 is the more important barrier. Until HYPE recovers it, an advance from the current level would remain a relief bounce inside a weakening structure rather than a confirmed trend reversal.
The next major resistance above the moving average is the 0.236 retracement near $67.8. Reclaiming that area would begin to challenge the sequence of lower highs established since June.
| Price Level | Technical Role |
|---|---|
| $57.6 | The midpoint of the spring rally and the first level HYPE needs to reclaim. |
| $56.7 | The 100-day moving average supporting the current price zone. |
| $62 | Former support and the first meaningful resistance on a rebound. |
| $64 | The falling 50-day average separating a relief bounce from a stronger recovery. |
| $53 | The 0.618 retracement and the next major support below the current zone. |
A Daily Close Below the 100-Day Average Exposes $53
A completed candle beneath the 100-day average and the wider $57 shelf would weaken the remaining medium-term support structure.
The next measured level is the 0.618 Fibonacci retracement near $53. A move there would mean HYPE had surrendered more than 60% of its advance from $38 to $77.
Buyers could still attempt to form a base around that level, but a weak reaction would place the 0.786 retracement near $46.5 back into focus. Reaching that area would unwind most of the spring rally and return price much closer to its origin.
The Daily Close Will Confirm the Next Move
The chart is no longer best described through a triangle because the trendlines that formed it have already been broken. The cleaner structure is defined by the current $56.7–$57.6 decision zone, resistance at $62 and deeper support at $53.
The chart also does not provide a valid 200-day moving average because HYPE lacks sufficient Coinbase trading history. For now, the 50-day and 100-day averages, together with the Fibonacci grid, provide the relevant technical framework.
- Disclaimer:
This article is for informational purposes only and isn’t financial advice. Technical levels reflect chart conditions at the time of writing, not price predictions – HYPE is a newer, highly volatile asset. Always do your own research before trading. - Methodology:
Price levels are based on the daily HYPE/USD chart on Coinbase via TradingView, captured July 25, 2026.

Kosta has reported on cryptocurrency markets and blockchain infrastructure since 2020, bringing over six years of hands-on experience in the crypto industry built through daily tracking of markets, trends, and emerging blockchain developments. Specializing in Bitcoin on-chain analysis, institutional ETF flows, and digital asset price action, his work at Coindoo has been cited by other news agencies and consistently covers market developments with a focus on data-driven reporting across Bitcoin, Ethereum, Solana, and XRP.
Over the years, Kosta has contributed to multiple crypto media outlets in different regions, authoring over 6,000 articles across the sector. His reporting spans cryptocurrency markets and the broader fintech industry, tracking not only price action but also the technological and regulatory forces shaping the ecosystem.
To support his analysis, Kosta actively leverages on-chain data and metrics from leading platforms such as Santiment, Glassnode, and CryptoQuant, enabling deeper, evidence-based market insights. He believes in the power of transparency and the data that underpins the blockchain ecosystem.
His academic background in Marketing Management from Denmark further complements his analytical approach, adding a strong understanding of communication strategy and content positioning to his work.



Be the first to comment