


What to know:
- DOT slips below trendline support as sellers defend the key $1.48-$1.50 zone.
- Analyst sees $1.20 as the next downside target if current DOT support breaks.
- RSI and MACD remain weak as long liquidations lead DOT’s latest market shakeout.


Polkadot (DOT) continued its bearish trend on Sunday, March 22, as investors focused on a critical support area. The token is currently trading at $1.47 as it struggles following its recent decline on the chart. The low trading volumes and derivatives data indicate a bearish sentiment.
In the last 24 hours, the price of the token increased by 2.39%, according to CoinMarketCap data. However, the trading volume declined by 13.65% and is currently standing at $132.58 million. Over the last seven days, the price of the token increased by 4.18%.

DOT Breakdown Puts $1.20 in Focus
Analyst Cryptorphic highlighted that DOT has fallen below the rising trendline support. The price of the token is currently having difficulty re-entering the price range of $1.48 to $1.50. This price range is important because the token has already experienced several rejections in the area.
The analyst also mentioned that there is a shift in the momentum, but it is now to the downside. This means that the recent bounce is not strong but a weak retest of the broken support level. This has kept traders focused on whether the asset can hold up at the current level.

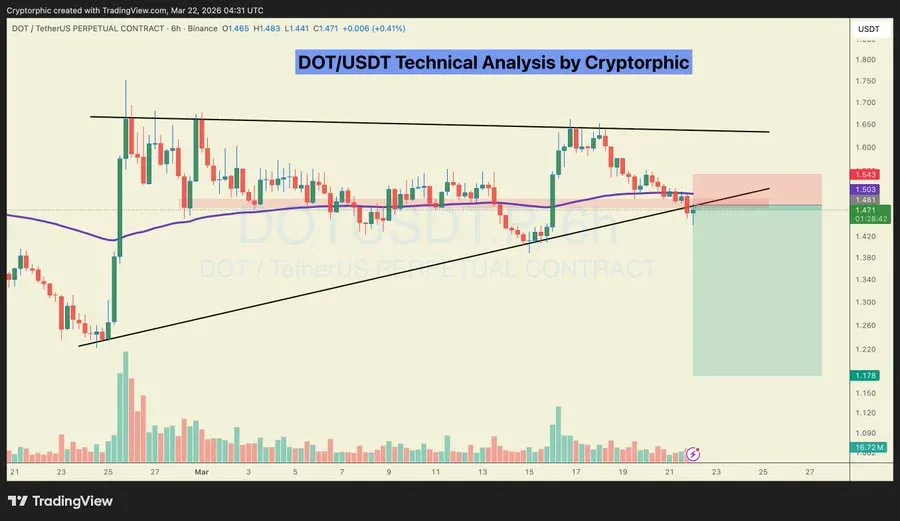
If DOT is unable to hold up at the current level, the next target will be at $1.20, according to the analyst. This level is now being seen as the next target of the token in the current structure.
Also Read: Polkadot Sets 2.1 Billion DOT Cap in Economic Overhaul
Open Interest and Volume Drop
CoinGlass data shows a dip in the activity of the derivatives market. Volume dropped by 1.77% to $240.13 million, and open interest declined by 1.94% to $184.55 million. The OI-weighted funding stood at 0.0020%.
Liquidation data added more detail to the market picture. Total liquidations reached $421.48K in the last 24 hours. Long liquidations stood at $406.20K, and short liquidations totaled $15.28K. This shows that bullish traders took most of the losses during the latest move.
Technical Indicators Stay Weak
According to TradingView data, the Relative Strength Index (RSI) reads at 47.43, and its moving average is at 50.78. The RSI is still below the 50-point level. It is also below its average, indicating less buying pressure.
The Moving Average Convergence Divergence (MACD) data is also indicative of weak momentum. The MACD line is at 0.005, and the signal line sits at 0.008. The histogram reads at -0.004. This indicates that the bearish crossover is still prevailing and the momentum remains slightly negative.
This article contains market analysis and price predictions. These are not guarantees. Crypto markets are volatile. Always DYOR. Not financial advice.
Also Read: Chiliz (CHZ) Eyes $0.25 as Falling Wedge Signals Strong Bullish Momentum

Be the first to comment