



Solana [SOL] traded near $74 on July 28 after another rejection at the $78 resistance level, bringing the key $72 support zone back into focus.
The recent sell-off has weakened SOL’s short-term technical structure. At the same time, elevated derivatives activity points to the potential for larger price swings. However, steady network usage and growing stablecoin liquidity suggest the broader ecosystem remains resilient.
Sellers remain in control below $78
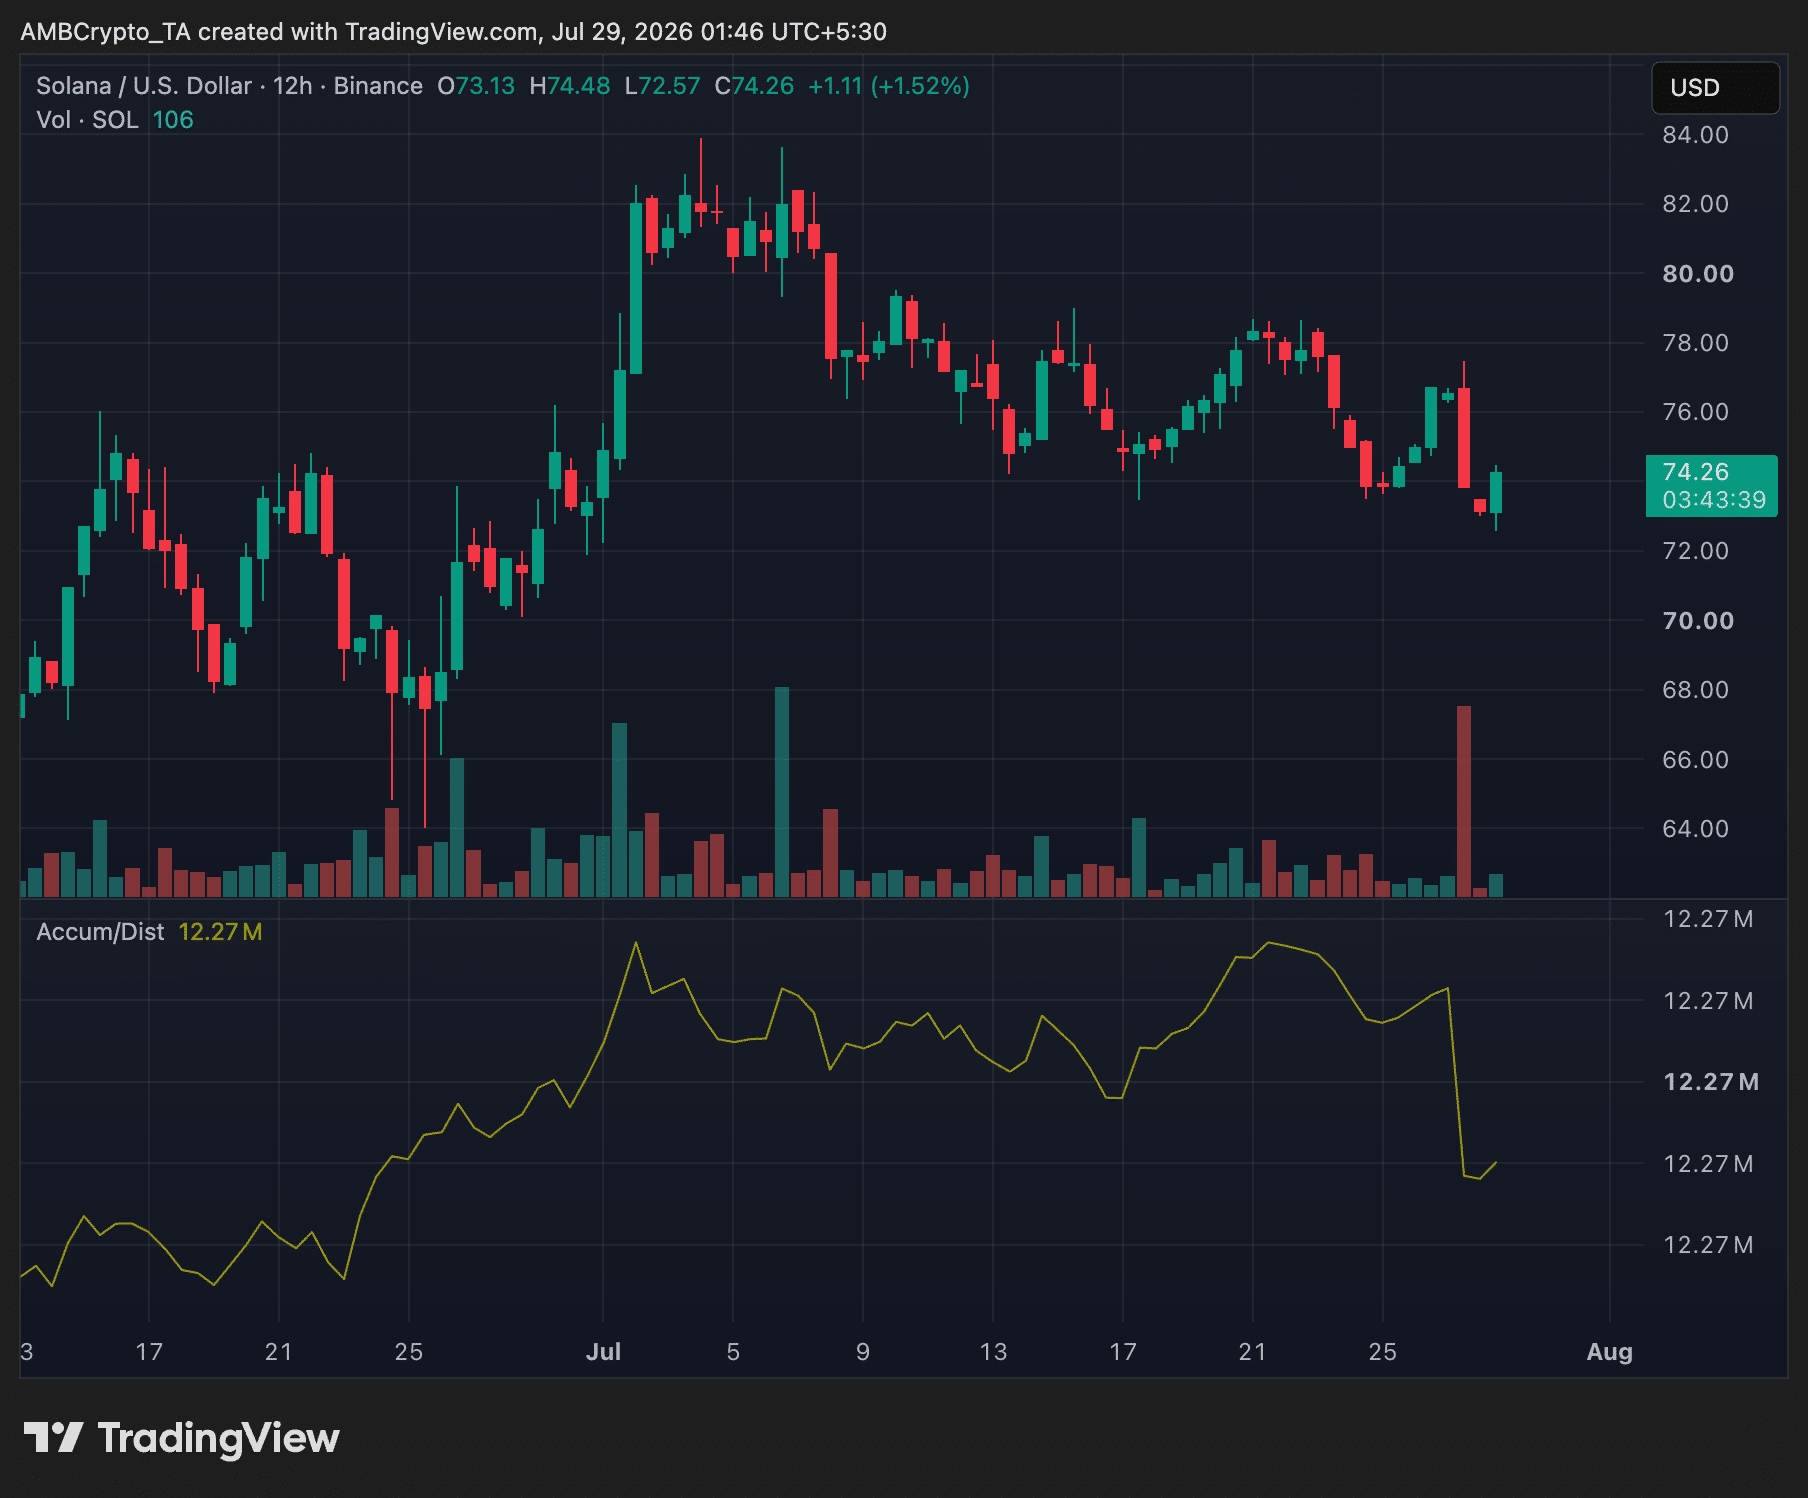
The 12-hour SOL/USD chart shows SOL has continued to print lower highs since peaking near $82 earlier in July.
Each attempt to reclaim $78 has been rejected, with the latest decline accompanied by one of the largest red volume bars on the chart.

The Accumulation/Distribution indicator also moved sharply lower, suggesting selling pressure intensified during the latest move.
Although SOL bounced from $72.57 to around $74.26, the recovery came on relatively light volume, indicating buyers have yet to regain control.
The immediate support remains between $72 and $73. A decisive break below that area could expose $68, where buyers previously stepped in during June.
For the bearish outlook to weaken, SOL would need to reclaim $76 before securing a daily close above $78.
Derivatives market could amplify the next move
Solana’s derivatives market continues to outweigh activity in the spot market.
CoinGlass data showed approximately $4.62 billion in open interest alongside $7.04 billion in 24-hour futures volume, compared with roughly $422.71 million in spot trading volume.
The platform also recorded around $16.65 million in liquidations over the past 24 hours.
That imbalance highlights how heavily leveraged positioning continues to influence SOL’s price action. If support or resistance gives way, derivatives positioning could accelerate the next move in either direction.
Network activity remains a constructive signal
Despite the weaker price action, Solana’s on-chain metrics remain relatively healthy.
According to DeFiLlama, the network processed around $9.83 billion in decentralised exchange volume over the past seven days, down 4.74% from the previous week.
Daily active addresses remained near 2.16 million, while Solana’s stablecoin market capitalisation rose 9.85% over the same period to approximately $16.65 billion.
Those figures suggest liquidity and user activity remain resilient even as SOL struggles to regain upside momentum.
Can SOL hold $72?
The answer may depend on whether strong network activity begins translating into renewed buying interest.
For now, technical indicators continue to favour sellers. At the same time, leveraged positioning leaves SOL vulnerable to sharper swings if the current range breaks.
If buyers successfully defend $72-$73, Solana could attempt another move towards $78. However, a decisive break below $72 would increase the likelihood of a retest of $68, with the much-discussed $60 level becoming a more realistic downside target only if that support also fails.
Final Summary
- SOL remains under technical pressure after another rejection below $78, leaving the $72-$73 support zone as the key level to watch.
- Strong network activity and rising stablecoin liquidity provide a constructive backdrop. Still, derivatives positioning could magnify SOL’s next move, whether up or down.






Be the first to comment