


What to know:
- XLM stays under pressure as a weak rebound fails to confirm a market bottom.
- Support at $0.161-$0.153 is key, while $0.170-$0.178 remains the first resistance.
- Falling volume and open interest show traders remain cautious on XLM’s next move.


Stellar (XLM) continued to face pressure on Sunday, March 22. The token experienced a weak rebound that did not confirm the bottom. XLM trades in a tight range, and the immediate levels of support and resistance remain the focus for the market.
As of writing, Stellar (XLM) is trading at $0.1621, showing a decline of 2.47% in the past 24 hours. The trading volume is also down by 9.57% and is currently standing at $73.87 million. Over the last week, the token price has decreased by 3.25%, according to CoinMarketCap data.

XLM Downside Risk Grows if Support Breaks
Analyst More Crypto Online highlighted that the XLM price increase from its low in February still looked more like a 3-wave pattern. Such a pattern did not yet confirm that a low was in place. Thus, the recent rebound did not yet signal a trend reversal.
The analyst identified micro levels of support between $0.161 and $0.153. This is now the first level of support that the XLM bulls need to hold. If it fails, the next support zone is between $0.142 and $0.148.
This level has provided repeated reactions since the low in February. If the token price goes below the top of the support zone, it will be more likely to fall.
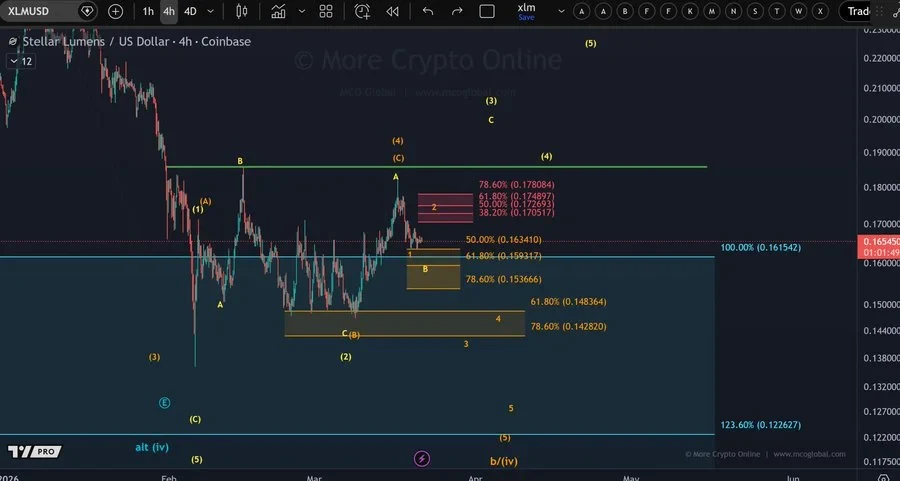

Further downward, the next two supports would be at $0.122 and $0.103. These supports would be relevant only if the current support zones fail.
On the upside, XLM has still not moved beyond its high of $0.185 in February. The first resistance zone for the token lies between $0.170 and $0.178. Breaking beyond $0.178 would ease the downward pressure and improve the near-term outlook.
Also Read: Polygon (POL) Holds Key Support in Falling Wedge With $0.41 in Sight
Derivatives Data Shows Cautious Trader Sentiment
CoinGlass data shows that future volume declined by 15.77% to $96.27 million. However, the open interest decreased by 2.09% to $84.46 million. The OI-weighted funding rate currently stands at 0.0031%. This reading shows only a slight positive bias, with traders still avoiding aggressive positioning.
XLM Trades Below Key EMAs
From a technical perspective, the daily chart shows XLM is trading below all four major EMAs. This keeps the trend weak overall. The 20-day EMA is currently trading at $0.1634, with the 50-day EMA trading at $0.1699. However, the token is trading below both EMAs, and short-term momentum remains soft.
The long-term averages show a wider gap. The 100-day EMA is at $0.1928, while the 200-day EMA is at $0.2304. These levels are higher than the current price. This means XLM still has a long way to go in terms of overcoming the overhead resistance as it attempts a bounce.
The Bollinger Band data also shows a cautious setup. The middle band is at $0.1611, the upper band sits at $0.1766, and the lower band is at $0.1454.
XLM is trading near the lower band. This shows that the token is holding near equilibrium. However, it has not gained enough strength to trade near the upper band.
This article contains market analysis and price predictions. These are not guarantees. Crypto markets are volatile. Always DYOR. Not financial advice.
Also Read: Stellar (XLM) Surges: 1.4B worth Big Wins After Commodity Status

Be the first to comment