



What to know:
- NEAR Protocol (NEAR) price gains after a new TD Sequential buy signal hints at a possible trend reversal.
- Ali Martinez says the indicator has previously identified major reversal points for NEAR.
- NEAR must break above $1.86 to strengthen bullish momentum and target $2.10 resistance.
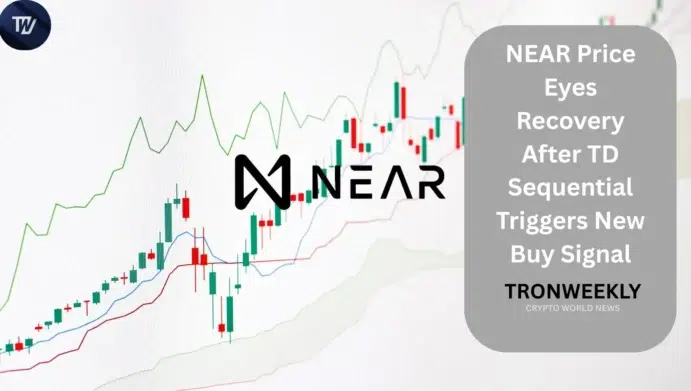
NEAR price is trending upwards following the emergence of a new buy signal by an important technical indicator. Though short-term sellers are still active, the current signal raises interest owing to its similarity with those that have predicted past price reversals.
At the time of writing, NEAR price is trading at $1.65, up 3.91% over the last 24 hours, with a daily trading volume of $304.51 million and a market capitalization of $2.15 billion.
NEAR Price Shows Recovery Signs
On July 30, 2026, a well-known crypto analyst, Ali Martinez, noted that the TD Sequential technical indicator had generated yet another buy signal for the NEAR Protocol coin.

Martinez explains that buy signals generated by the same indicator previously managed to accurately locate some significant reversal points of the cryptocurrency. Despite no technical indicator guaranteeing its future performance, TD Sequential has developed a certain reputation as a tool to spot a point where sellers stop pushing, and buyers return.
In the case of NEAR price, it may denote the beginning of the recovery phase provided that there is sustained buying pressure. For now, investors need some more strength from prices to confirm that it is indeed a trend reversal.
Also Read | CFTC Loss Deals Major Blow to Kalshi in Wisconsin Sports Betting Case
NEAR Price Still Faces Technical Resistance
Nevertheless, despite the good signal, the technical scenario appears to be rather contradictory.
NEAR price is currently trading close to the lower Bollinger Band at $1.6179, the middle one is placed at $1.8601, and the upper one is located at $2.1023. The fact of trading close to the lower band implies ongoing sell-off pressure.
The upside movement above the level of $1.8601 will be considered a good signal and indicate the beginning of buyers’ dominance.
MACD line is -0.07985 and is below the signal line, which has a value of -0.05257. The histogram value is -0.02728. All these values indicate that the bearish momentum is stronger than the buying momentum. If MACD does not move above the signal line, then NEAR can keep trading with negative short-term performance.
What Could Happen Next?
The next level to pay attention to is $1.86, corresponding to the middle Bollinger Band. A breakout of this level of resistance could allow NEAR price to move toward the upper Bollinger Band at $2.10, where sellers could step back into action.
On the other hand, if buyers cannot develop any strength, NEAR price may remain flat or revert to the support level of the lower Bollinger Band.
In the meantime, the TD Sequential indicator suggests a possibility of a decrease in selling pressure. It is going to take some time to see what is going to happen in the coming few trading days.
Also Read | Meta Stock Plunges 9% as Massive AI Spending Shakes Investors
This article contains market analysis and price predictions. These are not guarantees. Crypto markets are volatile. Always DYOR. Not financial advice.


Be the first to comment