


XRP price rebounded toward $1.10 on July 30 as fresh ETF inflows and Aviva Investors’ move onto the XRP Ledger supported demand, although the charts show that sellers remain active near current levels.
Summary
- XRP price rose 1.68% to $1.0917 on the daily chart after touching an intraday high of $1.0950.
- XRP ETFs recorded $584,000 in net inflows on July 29, ending a 4-day pause.
- The 4-hour chart places XRP at the $1.0908 Fibonacci resistance, with cash flow still negative.
- Liquidation clusters near $1.10 and $1.065 could shape the token’s next short-term move.
XRP price rebounds but stays below daily resistance
According to data from crypto.news, XRP (XRP) price traded at $1.0917 at press time, gaining 1.68% after moving between $1.0685 and $1.0950. The rebound followed a decline that briefly pushed the token toward $1.045 earlier in the week.

Despite the recovery, XRP has not confirmed a broader bullish reversal. Its price remains slightly below the daily chart’s Bollinger Bands’ 20-day middle line at $1.0975, which now acts as immediate resistance.
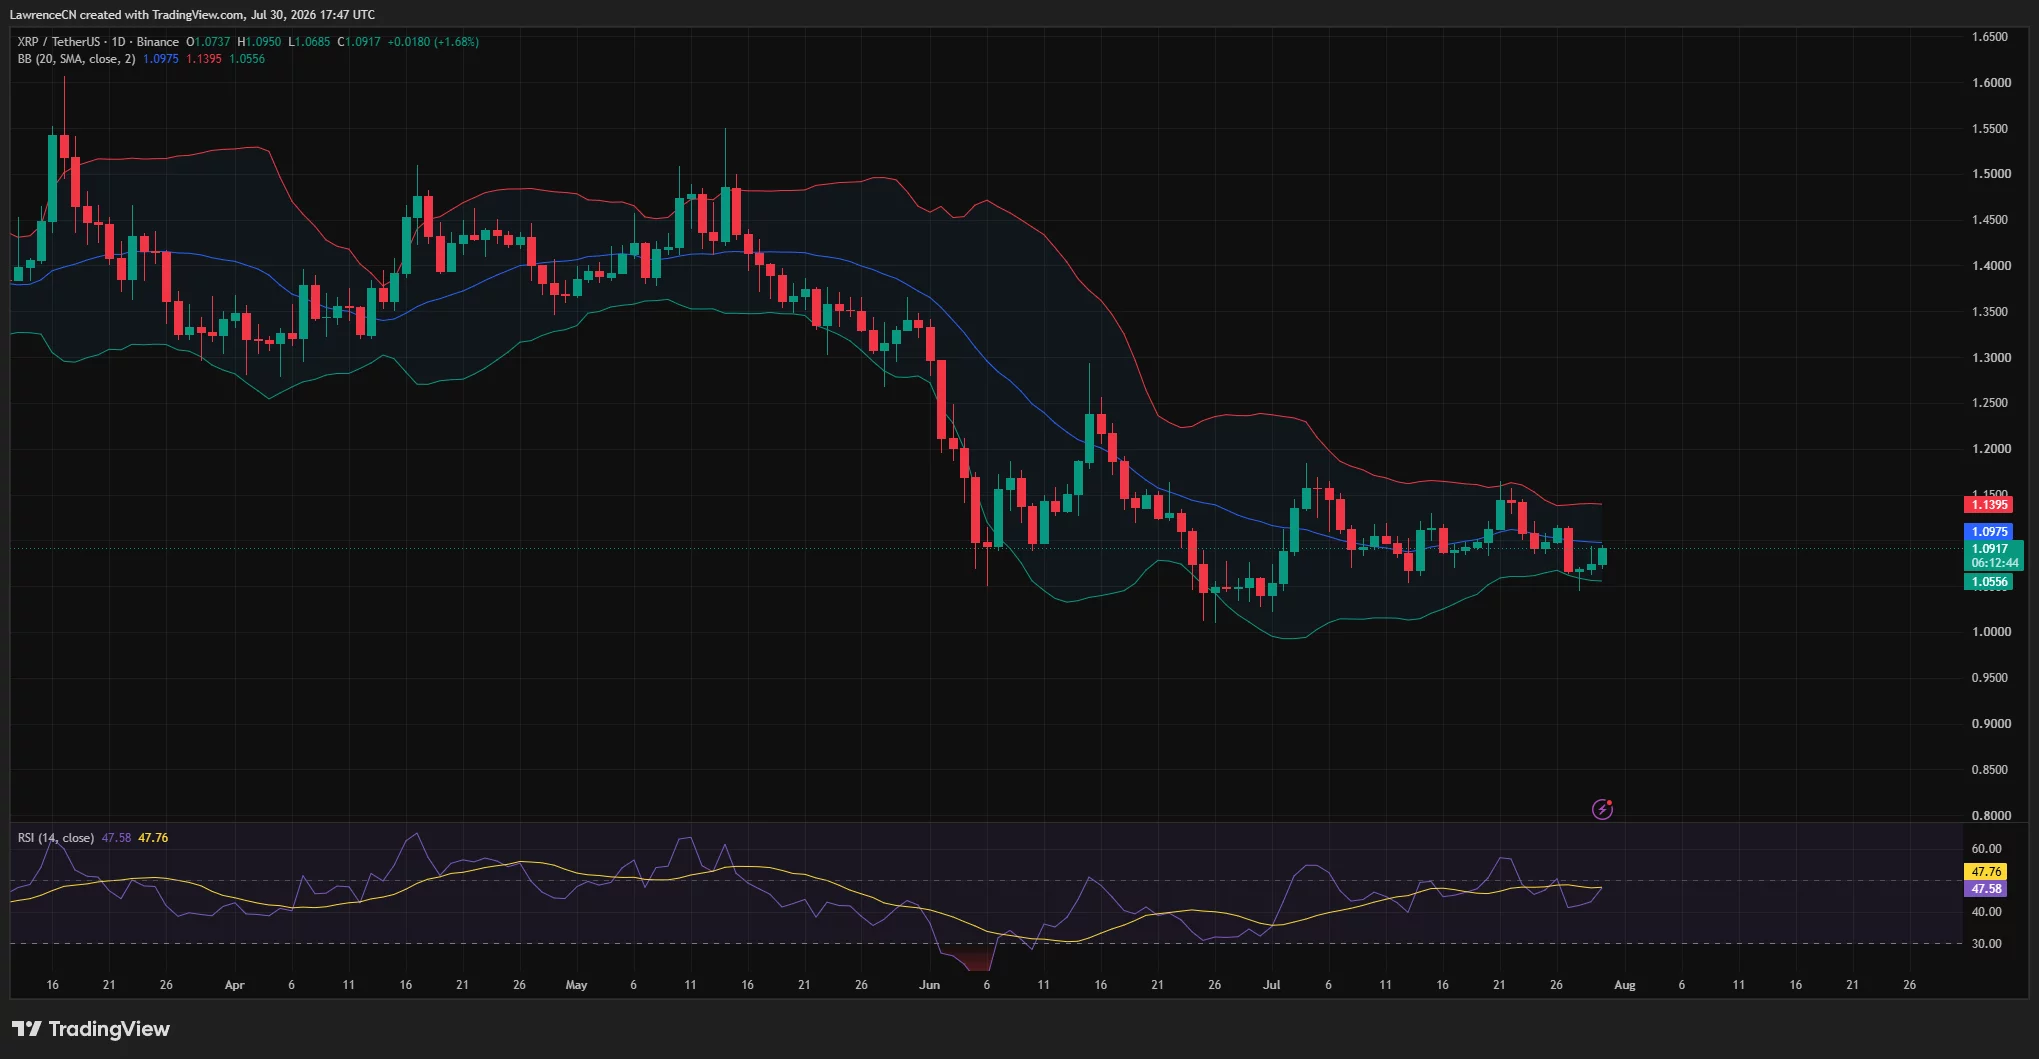
A daily close above that level would place XRP back in the upper half of the Bollinger range. The next visible target would be the upper band at $1.1395, representing a potential gain of about 4.4% from the current price.
Momentum is still neutral. The daily relative strength index stands at 47.58, marginally below its signal line at 47.76 and under the neutral reading of 50.
That setup shows that buying pressure has improved from late-June levels, but bulls have not regained firm control. XRP has also traded sideways since early July after its sharp fall from above $1.40 in May.
ETF inflows return as Aviva adopts XRP Ledger
The recovery coincided with $584,000 in net inflows into XRP exchange-traded funds on July 29, according to SoSoValue. It marked their first positive daily flow since July 25.
The funds have remained net positive on a weekly basis for three consecutive weeks. However, the latest daily total remains small compared with XRP’s reported $1.26 billion in spot trading volume.
Institutional interest also received support from Aviva Investors, a UK asset manager overseeing about $350 billion. The company plans to offer a tokenized share class of its USD Liquidity Fund on the XRP Ledger to eligible investors with crypto wallets.
Aviva’s move gives XRPL a large traditional-finance use case beyond payments and cryptocurrency trading. It follows the network’s implementation of the fixCleanup3_2_0 amendment on July 29.
For US investors, the return of ETF inflows provides a regulated way to measure demand for XRP exposure. However, uncertainty surrounding the CLARITY Act remains a risk because further delays could keep regulatory concerns in focus.
Four-hour XRP chart shows sellers near $1.09
The 4-hour chart places XRP directly against the 0.618 Fibonacci retracement level at $1.0908. This level is calculated from the decline between $1.1644 and $1.0453.
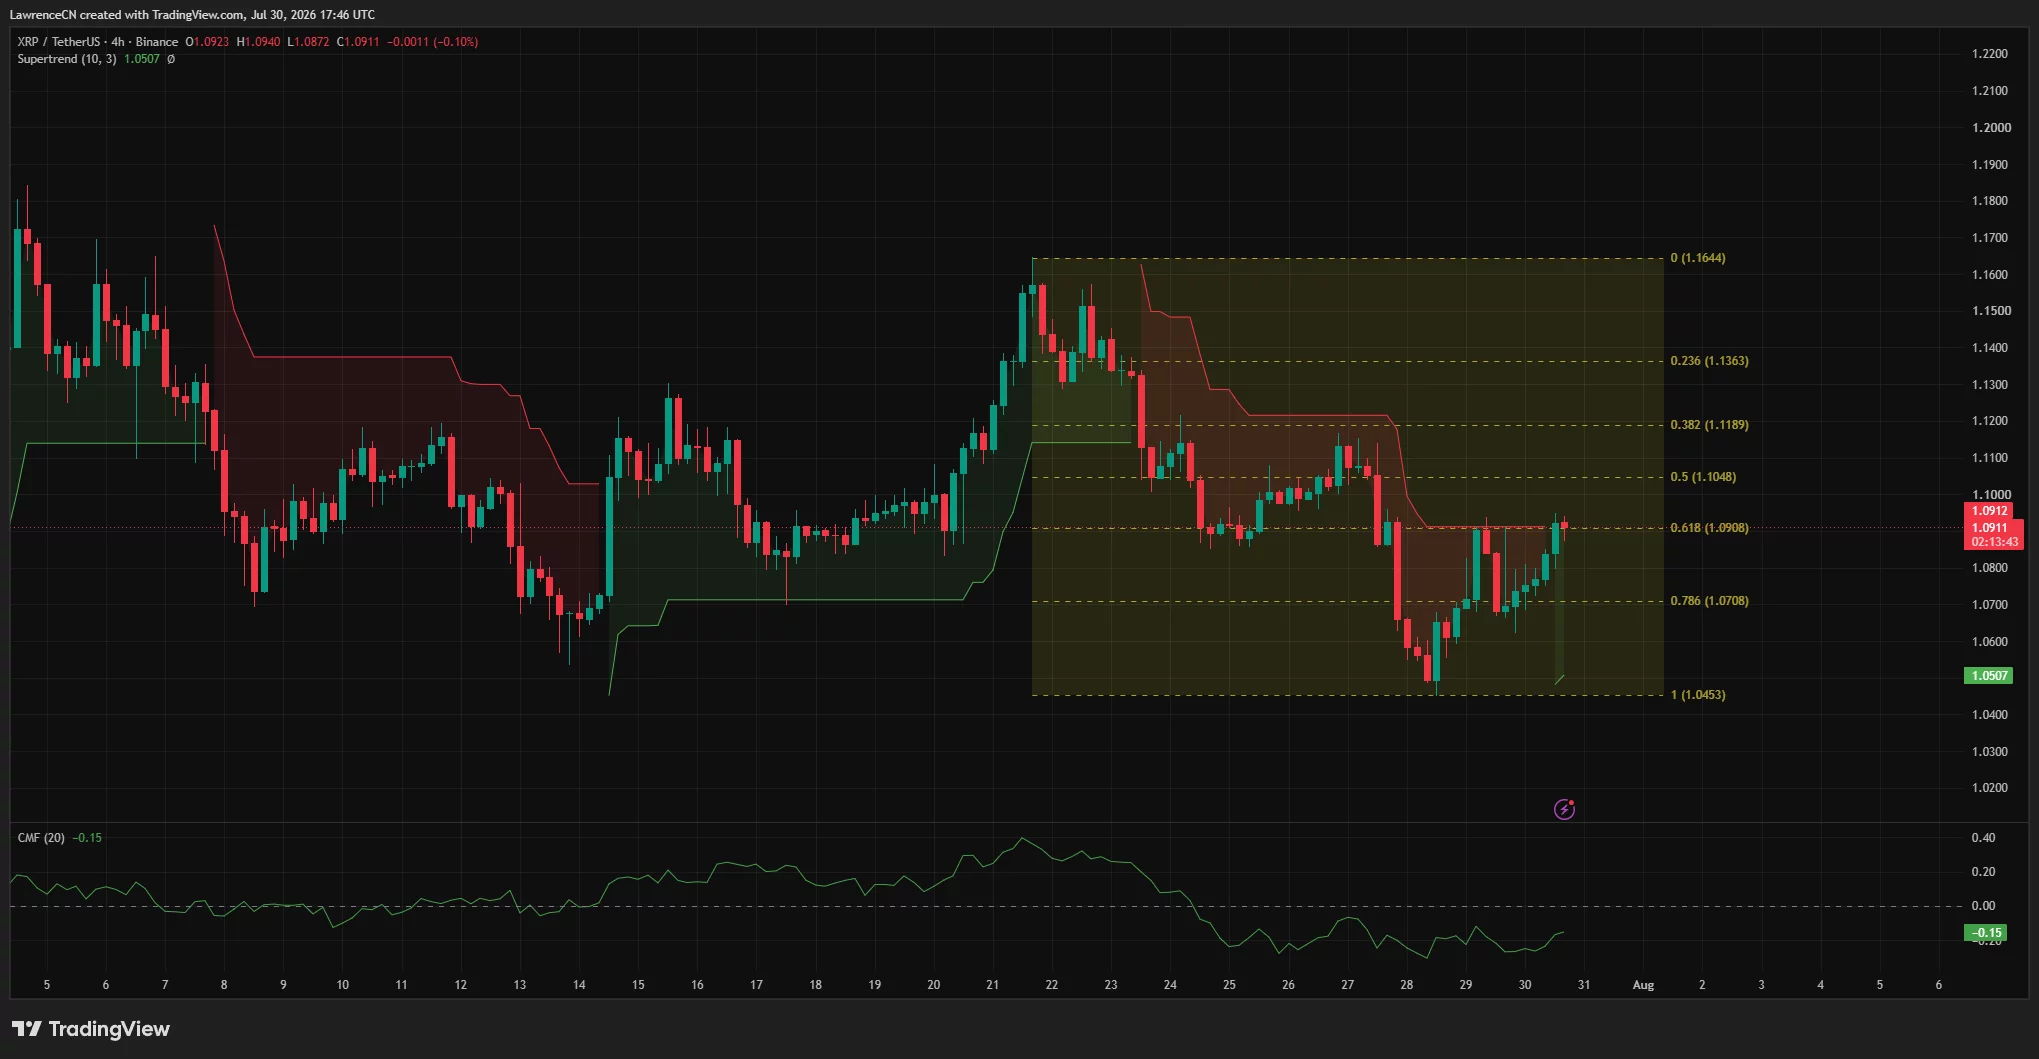
XRP briefly traded above the retracement level but had not secured a convincing 4-hour close beyond it. The Supertrend indicator also remained bearish, with its resistance line near $1.0912.
A confirmed break above this area would shift attention toward the 0.5 Fibonacci level at $1.1048. Higher targets sit at $1.1189, $1.1363 and the July swing high of $1.1644.
Money flow does not yet support a strong breakout. The 4-hour Chaikin Money Flow reading stands at minus 0.15, showing that capital continues to leave XRP despite the price recovery.
The negative CMF creates a divergence between rising prices and weak underlying demand. Unless the indicator moves above zero, a breakout beyond $1.10 may struggle to hold.
On the downside, $1.0708 is the first Fibonacci support. The 4-hour Supertrend support sits at $1.0507, close to the recent swing low and the daily lower Bollinger Band at $1.0556.
Liquidation heatmap identifies the next XRP targets
CoinGlass’ three-day liquidation heatmap shows a dense concentration of leveraged positions immediately above XRP’s price. The strongest nearby liquidity rests around $1.098 to $1.10, aligning with the technical resistance identified on both price charts.
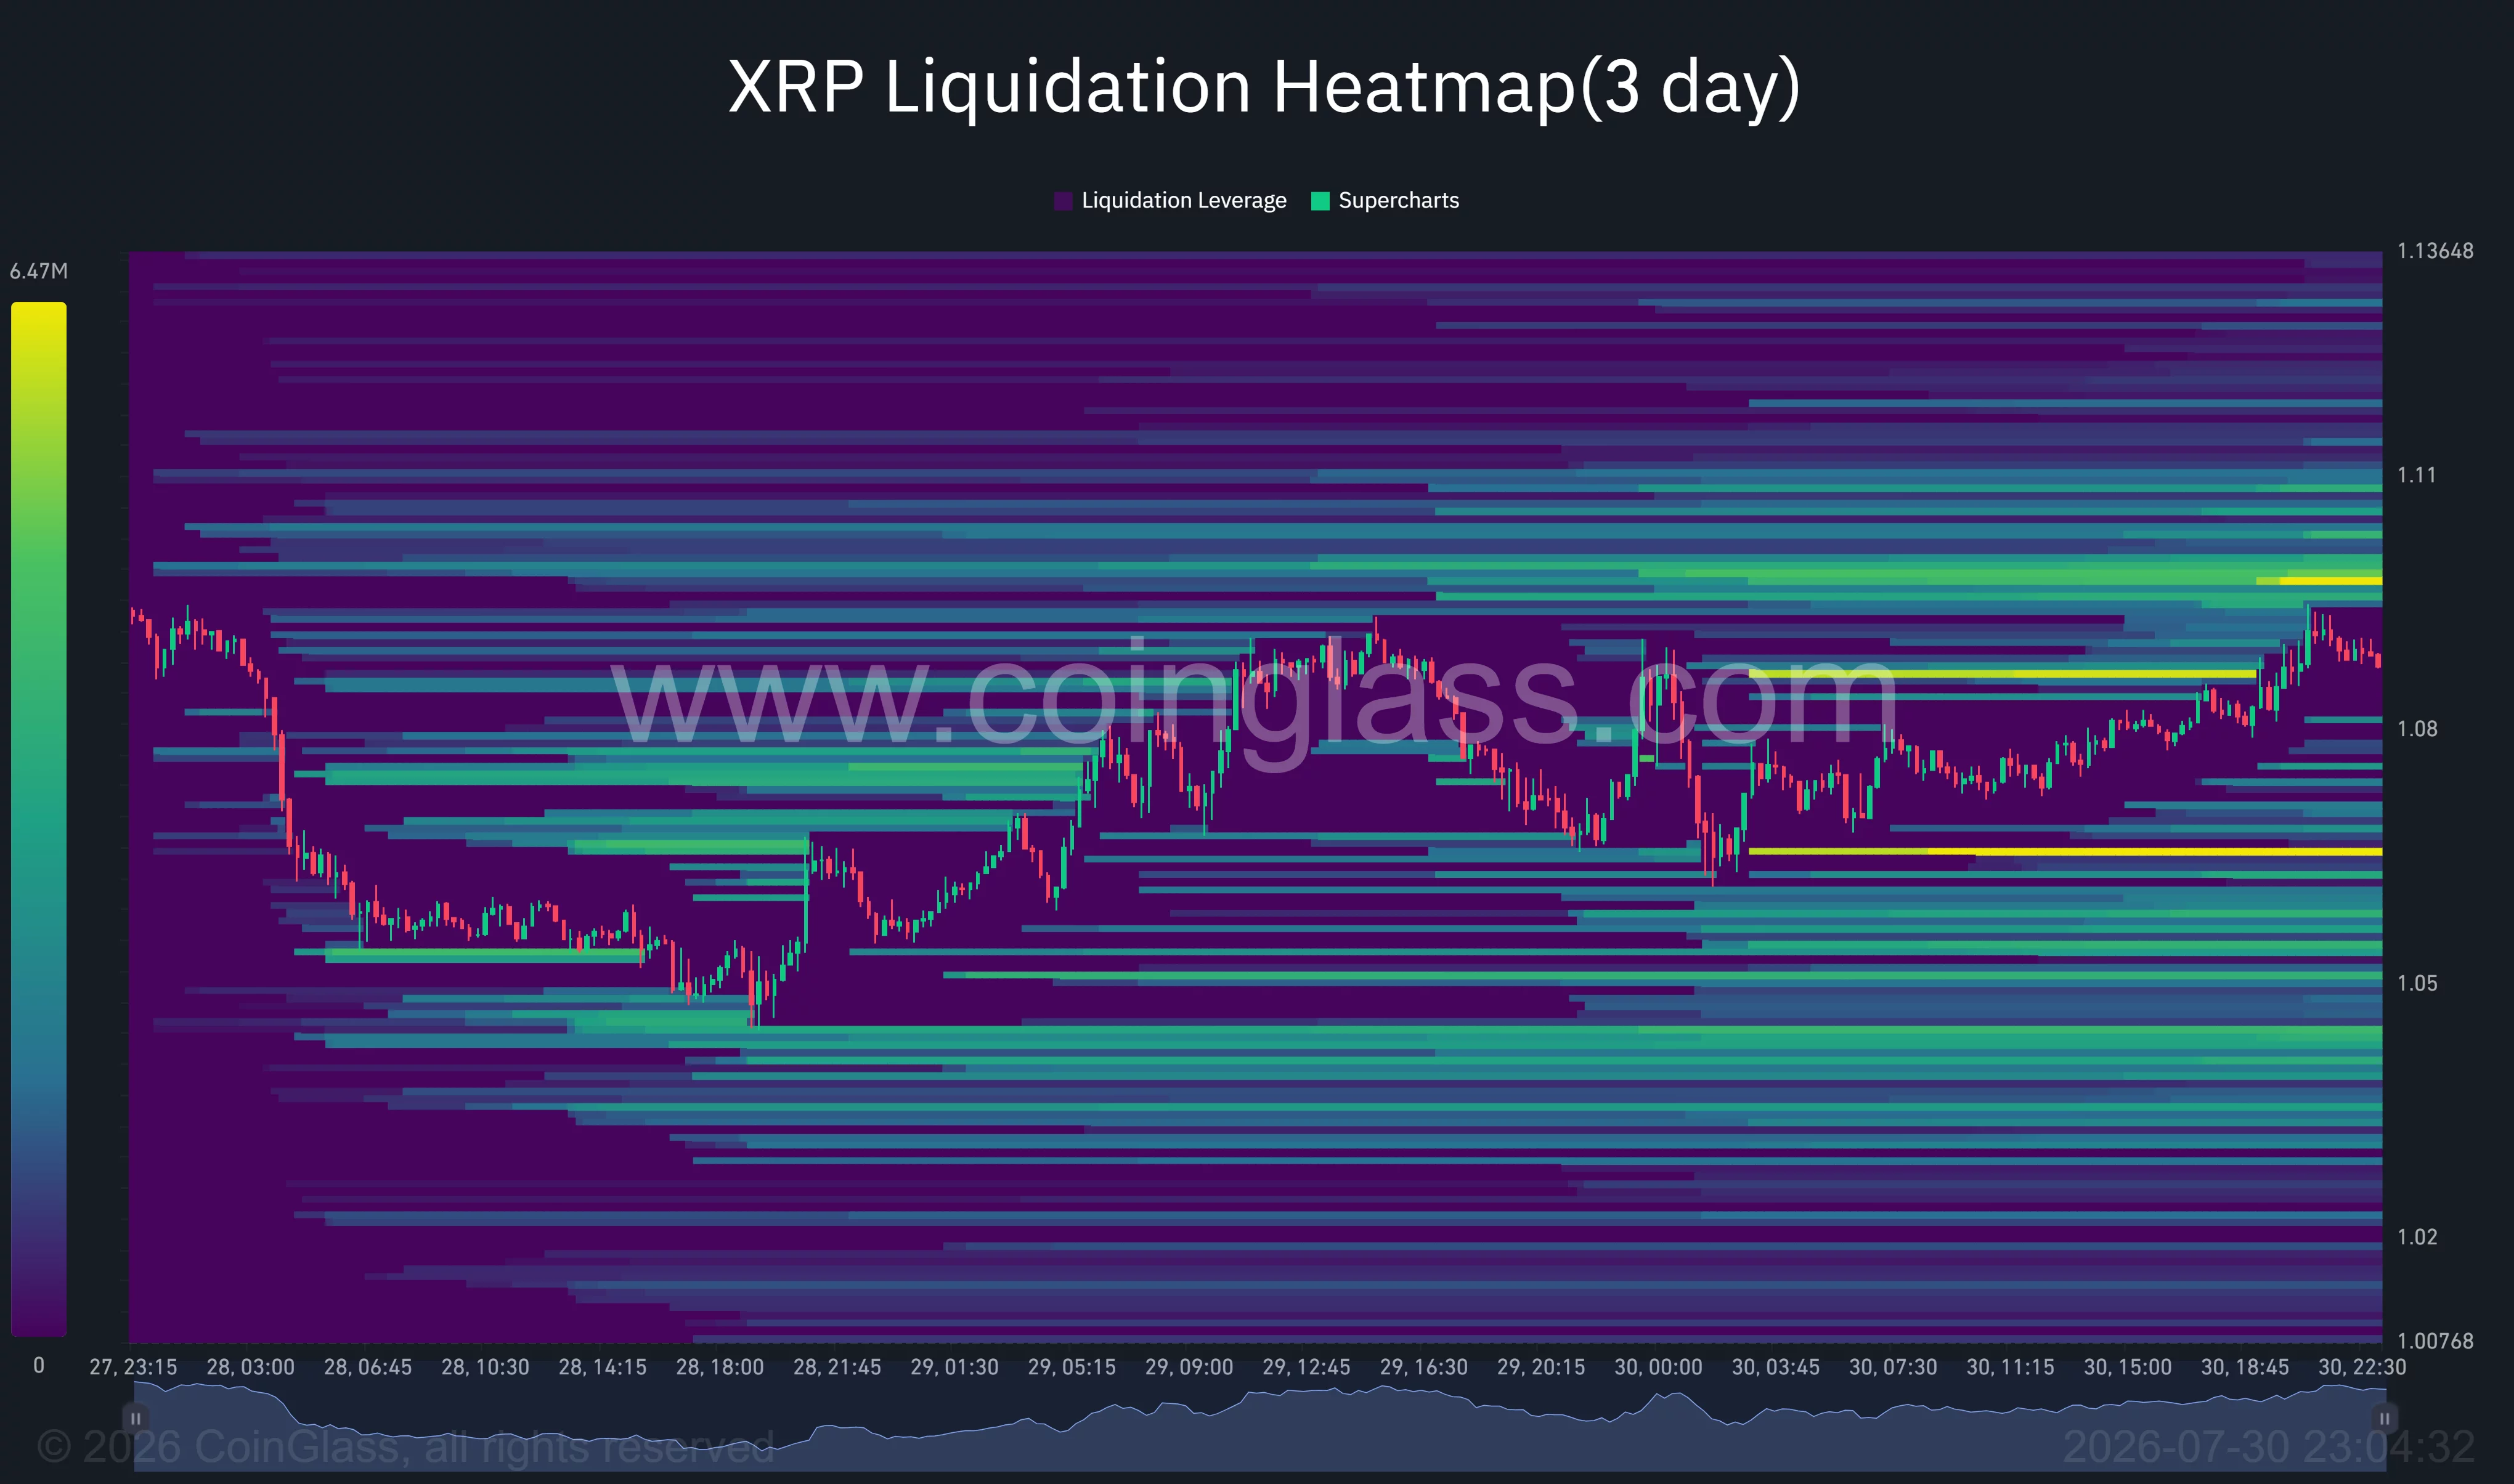
Markets often move toward large liquidation pools because forced position closures can add momentum. A break through $1.10 could therefore trigger short liquidations and push XRP toward the next liquidity band near $1.11.
A larger concentration is also visible just below $1.07, around $1.065. If XRP is rejected near $1.10, that lower pool could draw the price back toward the $1.0708 Fibonacci support.
Further downside liquidity appears between $1.04 and $1.05. A loss of $1.065 would therefore expose the recent low at $1.0453 and weaken the current recovery structure.
XRP’s immediate direction now depends on whether ETF-led demand can overcome the bearish Supertrend and negative money flow. A sustained close above $1.10 would strengthen the case for $1.1189 and $1.1395, while rejection could return the token to the $1.065–$1.071 support zone.
Disclosure: This article does not represent investment advice. The content and materials featured on this page are for educational purposes only.



Be the first to comment