


What to know:
- The ETC price remains below all major EMAs, with a death cross signaling continued bearish momentum.
- The $7.96 level serves as key support, with a breakdown risking new lows.
- MACD shows a weak bullish crossover near zero, indicating limited buying conviction.


Ethereum Classic (ETC) is showing a mild decline in its short-term price action after a mostly sideways trading session. According to CoinMarketCap, over the last 24 hours, ETC has slipped by approximately 3.28% and 2.06% over the last week.
Currently, ETC is trading at $8.12, with a 24-hour trading volume of $51.04 million, reflecting a 20.2% surge in activity. Its market capitalization stands at $1.26 billion, indicating steady investor interest despite the intraday pullback.


Source: CoinMarketCap
Also Read: Ethereum Classic (ETC) Tests Critical Support Before Explosive Bounce to $120
ETC Struggles to Hold Gains After Short Squeeze Pump
Ethereum Classic (ETC) is showing mixed technical signals after reclaiming its 50-day simple moving average on the USDT pair for the first time in nearly two months.
According to the crypto analyst Umair Crypto, as of Sunday, March 22, the move suggested early bullish momentum, but the ETC/BTC pair failed to confirm strength, indicating the recent rise was likely driven by broader market conditions rather than demand.

Source: Umair Crypto’s X Post
The level of $7.96 is now on traders’ radar as a key level that marks a current trading range. According to Umair Crypto, a close below this level could increase the chances of a breakdown and fresh lows, while a close above this level could result in a run to the level of resistance within this range, though weakness in Bitcoin pairs tempers this.
ETC Faces Downward Pressure Below All EMAs
According to TradingView, ETC indicates a persistent bearish trend as the token is stuck under all major exponential moving averages. The death cross alignment indicates a strong bearish trend, as the 200-day EMA is significantly above the current trading level of $8.12.
The token’s recent attempt to break through the 50-day EMA was unsuccessful, which indicates that the token is still facing significant overhead resistance.
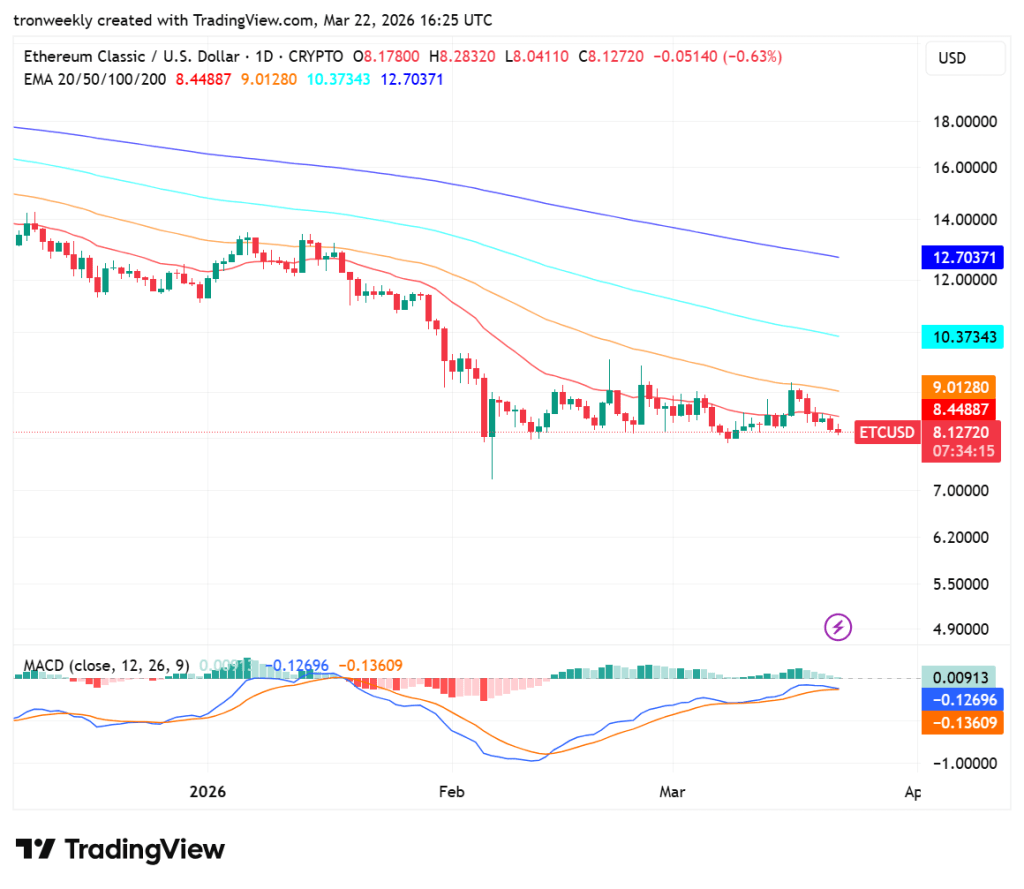
Source: TradingView
The MACD is indicating a weak bullish crossover near the zero line, but the flatness of the histogram indicates a lack of conviction among buyers.
Currently, the price is being tested on a critical psychological support level at $8.00. A break below this level could result in further weakness, while a break above $8.44 is needed to change the negative sentiment.
This article contains market analysis and price predictions. These are not guarantees. Crypto markets are volatile. Always DYOR. Not financial advice.
Also Read: Ethereum Classic (ETC) Falling Wedge Point to Possible Rally Toward $78

Be the first to comment