



What to know:
- The LUNA price is consolidating within a long-term rectangle pattern, with analysts eyeing a potential breakout toward $0.50.
- Buyers are defending the $0.040 support, but a daily close above $0.22–$0.25 is needed to confirm a bullish reversal.
- RSI near 31 and a bearish MACD indicate weak buying momentum, leaving sellers in short-term control.

Terra (LUNA) remains in a prolonged consolidation phase, with a rectangle pattern suggesting potential recovery if buyers maintain support and confirm a breakout. However, the broader trend remains bearish, while momentum indicators continue to show weak buying interest, leaving sellers in control until stronger bullish confirmation emerges.
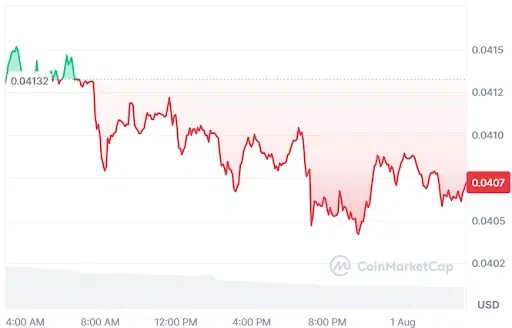
At the time of writing, LUNA is trading at $0.04071 with a 24-hour trading volume of $2.25 million and a market capitalization of $28.9 million. Despite the 1.83% loss over the last 24 hours, the LUNA price structure points to a bullish reversal, but momentum indicators still remain weak.
Source: CoinMarketCap

Also Read: Strategy Bitcoin Treasury Expands as Q2 Paper Loss Hits $8.22 Billion
LUNA Eyes $0.50 After Bullish Rectangle Pattern
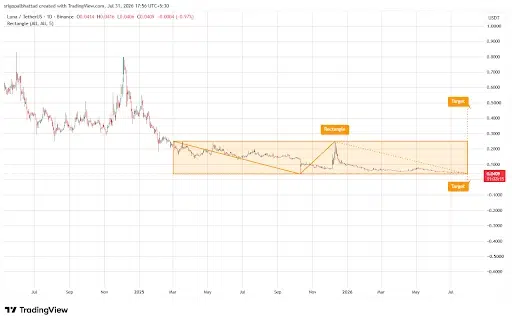
According to the crypto analyst Crypto With Gopal, LUNA continues trading within a long-term rectangle pattern on the daily chart after a prolonged downtrend, signaling a potential shift in market structure.
Price remains near the range’s lower boundary, where buyers continue defending key support. The extended consolidation suggests selling momentum is fading while long-term accumulation gradually strengthens ahead of a possible breakout.
Source: Crypto With Gopal’s X Post
In addition, a convincing daily break above the rectangle resistance range of $0.22 to $0.25, supported by increased volume, would be a sign of a bullish breakout, thereby clearing the way towards the $0.50 level.
In case of failure to hold onto the rectangle support, the outlook would become negative for the coin.
Momentum Indicators Point to Bearish Pressure
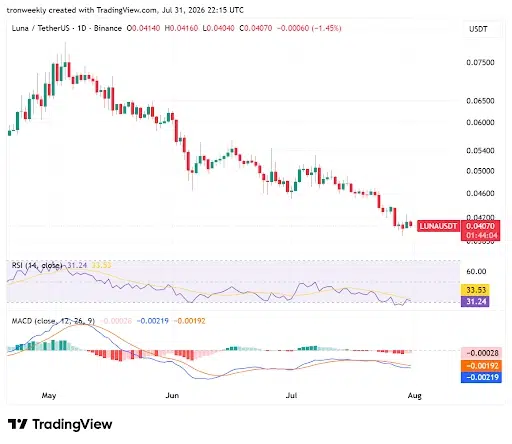
According to TradingView, LUNA remains intact in a well-defined bearish formation on the daily chart with a succession of lower highs and lower lows from May to date.
The price is trading close to $0.0407 near critical support at $0.0400 following unsuccessful attempts to rebound higher. The sustained weakness below the resistance level maintains the bearish tone in play.
Source: TradingView
The momentum oscillators support a bearish view. The RSI is around 31, which means there is little buying pressure in the market, and it is approaching an oversold level but not yet reversed.
On the other hand, the MACD indicator is below the zero line, and the MACD line is below the signal line.
What Happens Next for LUNA?
The next action for LUNA will depend on whether the buyers are able to defend the $0.040 support level and break past the resistance level between $0.22 and $0.25.
In case of a breakout coupled with significant trading volumes, the bullish rectangle formation would be confirmed, and the target could be at $0.50.
Also Read: Upbit Lists CFX, Expanding Conflux Access in South Korea
This article contains market analysis and price predictions. These are not guarantees. Crypto markets are volatile. Always DYOR. Not financial advice.



Be the first to comment