


Despite multiple attempts to reach higher levels, XRP is still under pressure; the asset is currently trading at about $1. 08. The recent symmetrical triangle that had been forming throughout the second half of July has resolved to the downside, according to the daily chart. Even though the breakdown hasn’t led to aggressive selling, it shows that buyers still don’t have enough momentum to buck the general trend.
Overall, the technical situation is still negative. The 50-day EMA ($1.09), 100-day EMA ($1.10), and 200-day EMA ($1.20) are all still below where XRP is trading. Any attempt at a recovery will probably encounter strong selling pressure before a more significant trend reversal can even start because those moving averages now create a stacked resistance zone directly above the current price.
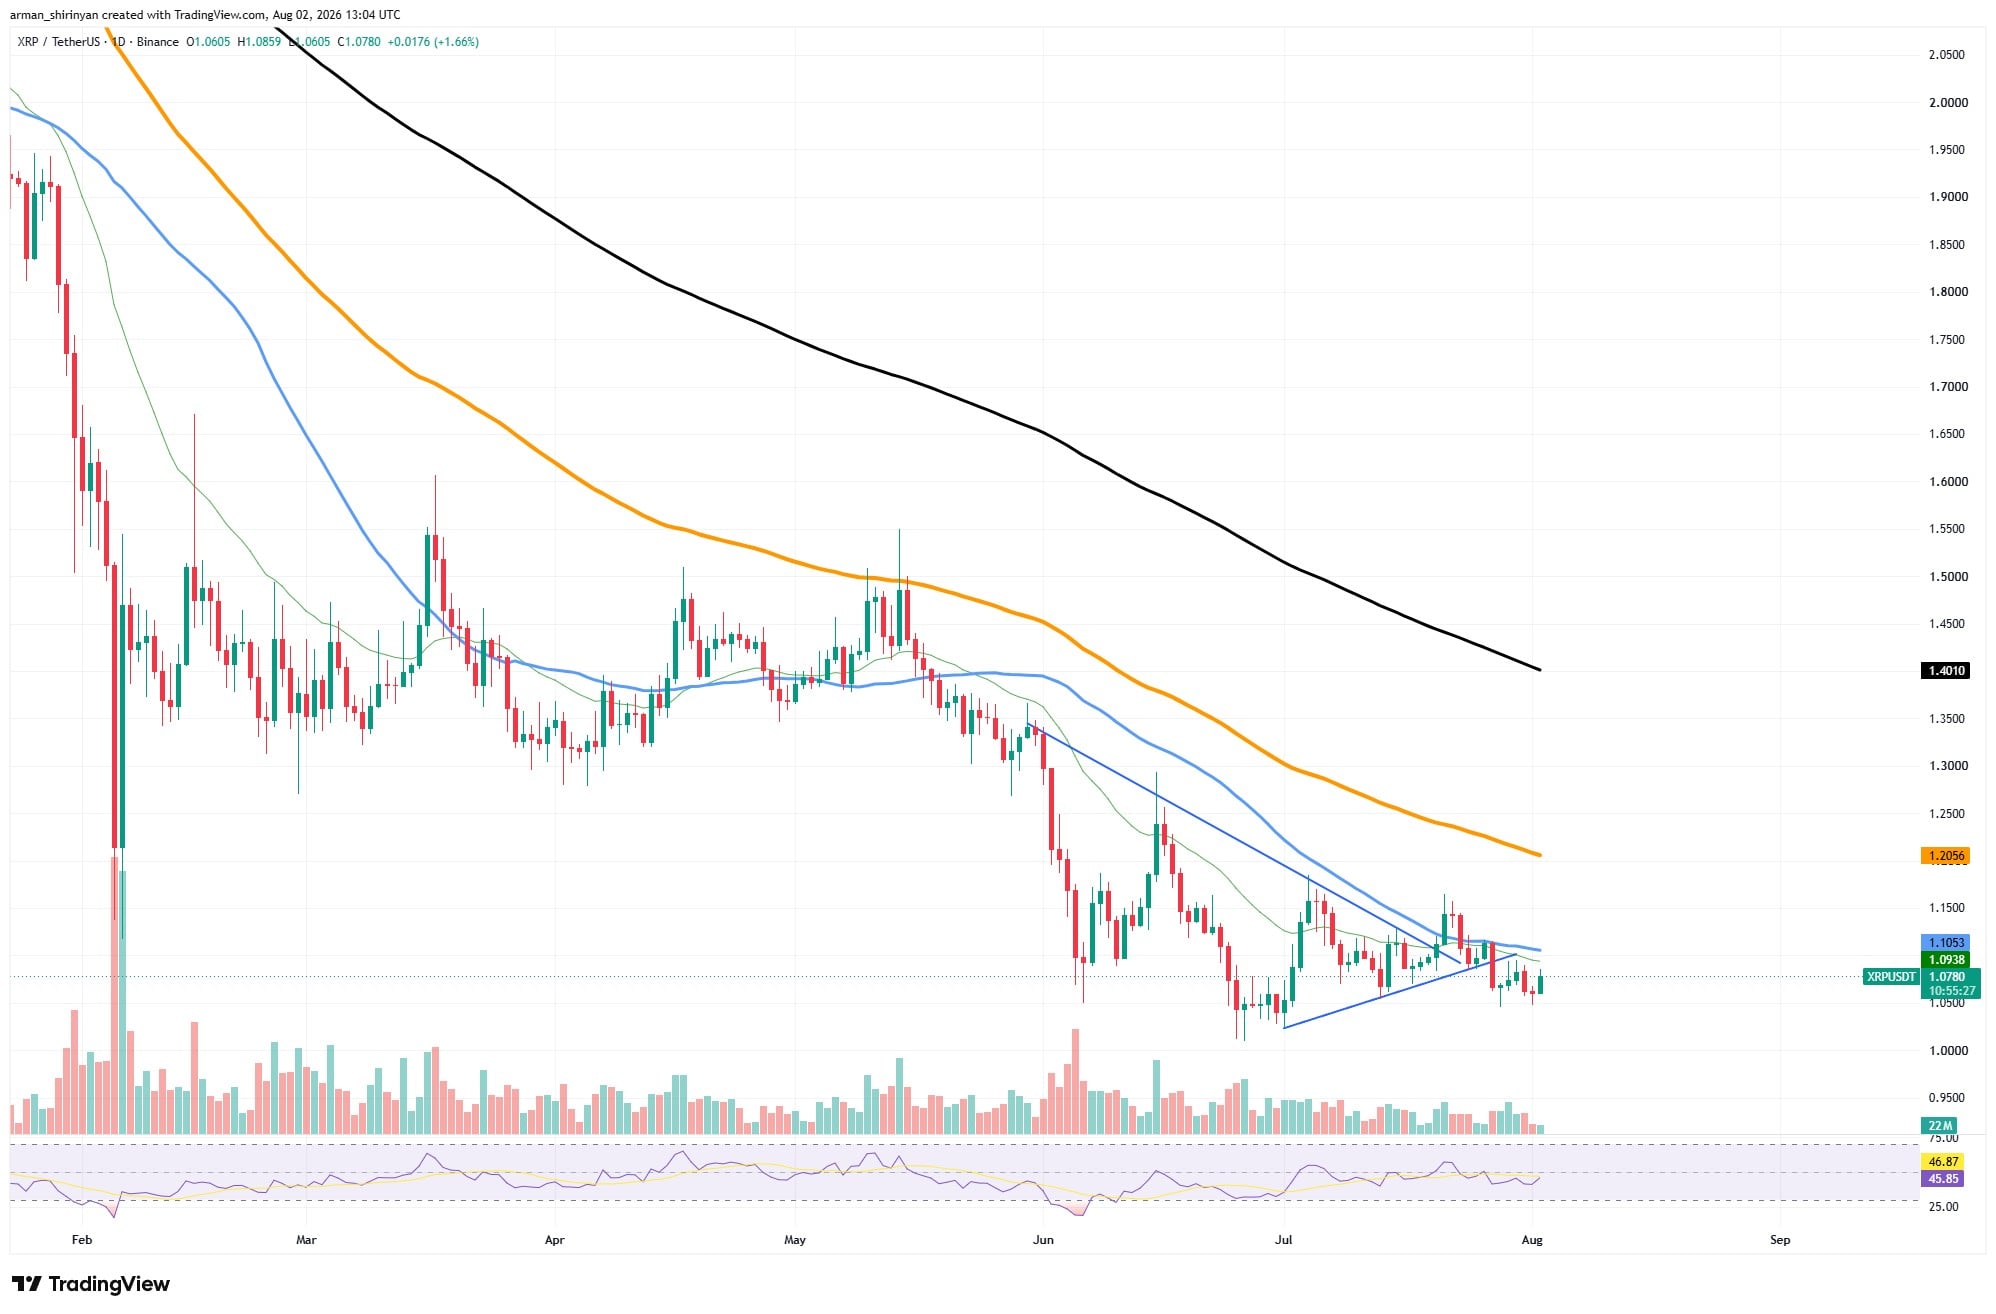
After the triangle breakdown, volume has also stayed comparatively quiet. Significant reversals are usually accompanied by increased trading activity, but this confirmation has not yet materialized.

Rather, market participation has steadily decreased, indicating that traders are holding off on making capital commitments until they see a more potent catalyst. The same hesitancy is reflected in momentum indicators. XRP is in neutral territory as the Relative Strength Index is close to 47.
The market isn’t strong enough to indicate a resurgence of bullish momentum or oversold enough to encourage aggressive bargain hunting. For bulls, recovering the 50-day EMA around $1.09 is the primary goal. The 100-day EMA close to $1.10 would come into focus with a successful move above that level.
The psychologically significant $1.20 area, where the long-term 200-year EMA presently resides, would become accessible if both moving averages were cleared. On the downside, XRP may experience another leg lower toward the $1.00 psychological level if the $1.05-$1.06 support area is not maintained.
The longer-term downward trend would be strengthened and market sentiment would be considerably weakened if that threshold were to be broken. For the time being, XRP is stuck between weakening momentum and close support; whether buyers can eventually reclaim the cluster of moving averages overhead will probably determine the next big move.
Can Bitcoin turn into growth?
After the sharp correction that erased its spring rally, buyers and sellers have shown little urgency as Bitcoin continues to consolidate around $63,000. After failing to maintain gains above $80,000 earlier this year, the daily chart shows a market looking for direction.
Over the past few weeks, Bitcoin has developed a comparatively stable trading range, in contrast to many other altcoins. The 50-day EMA, which is currently nearly exactly at the market price at $63,950, has seen a compression in price action. Instead of a strong directional trend, this suggests short-term equilibrium.
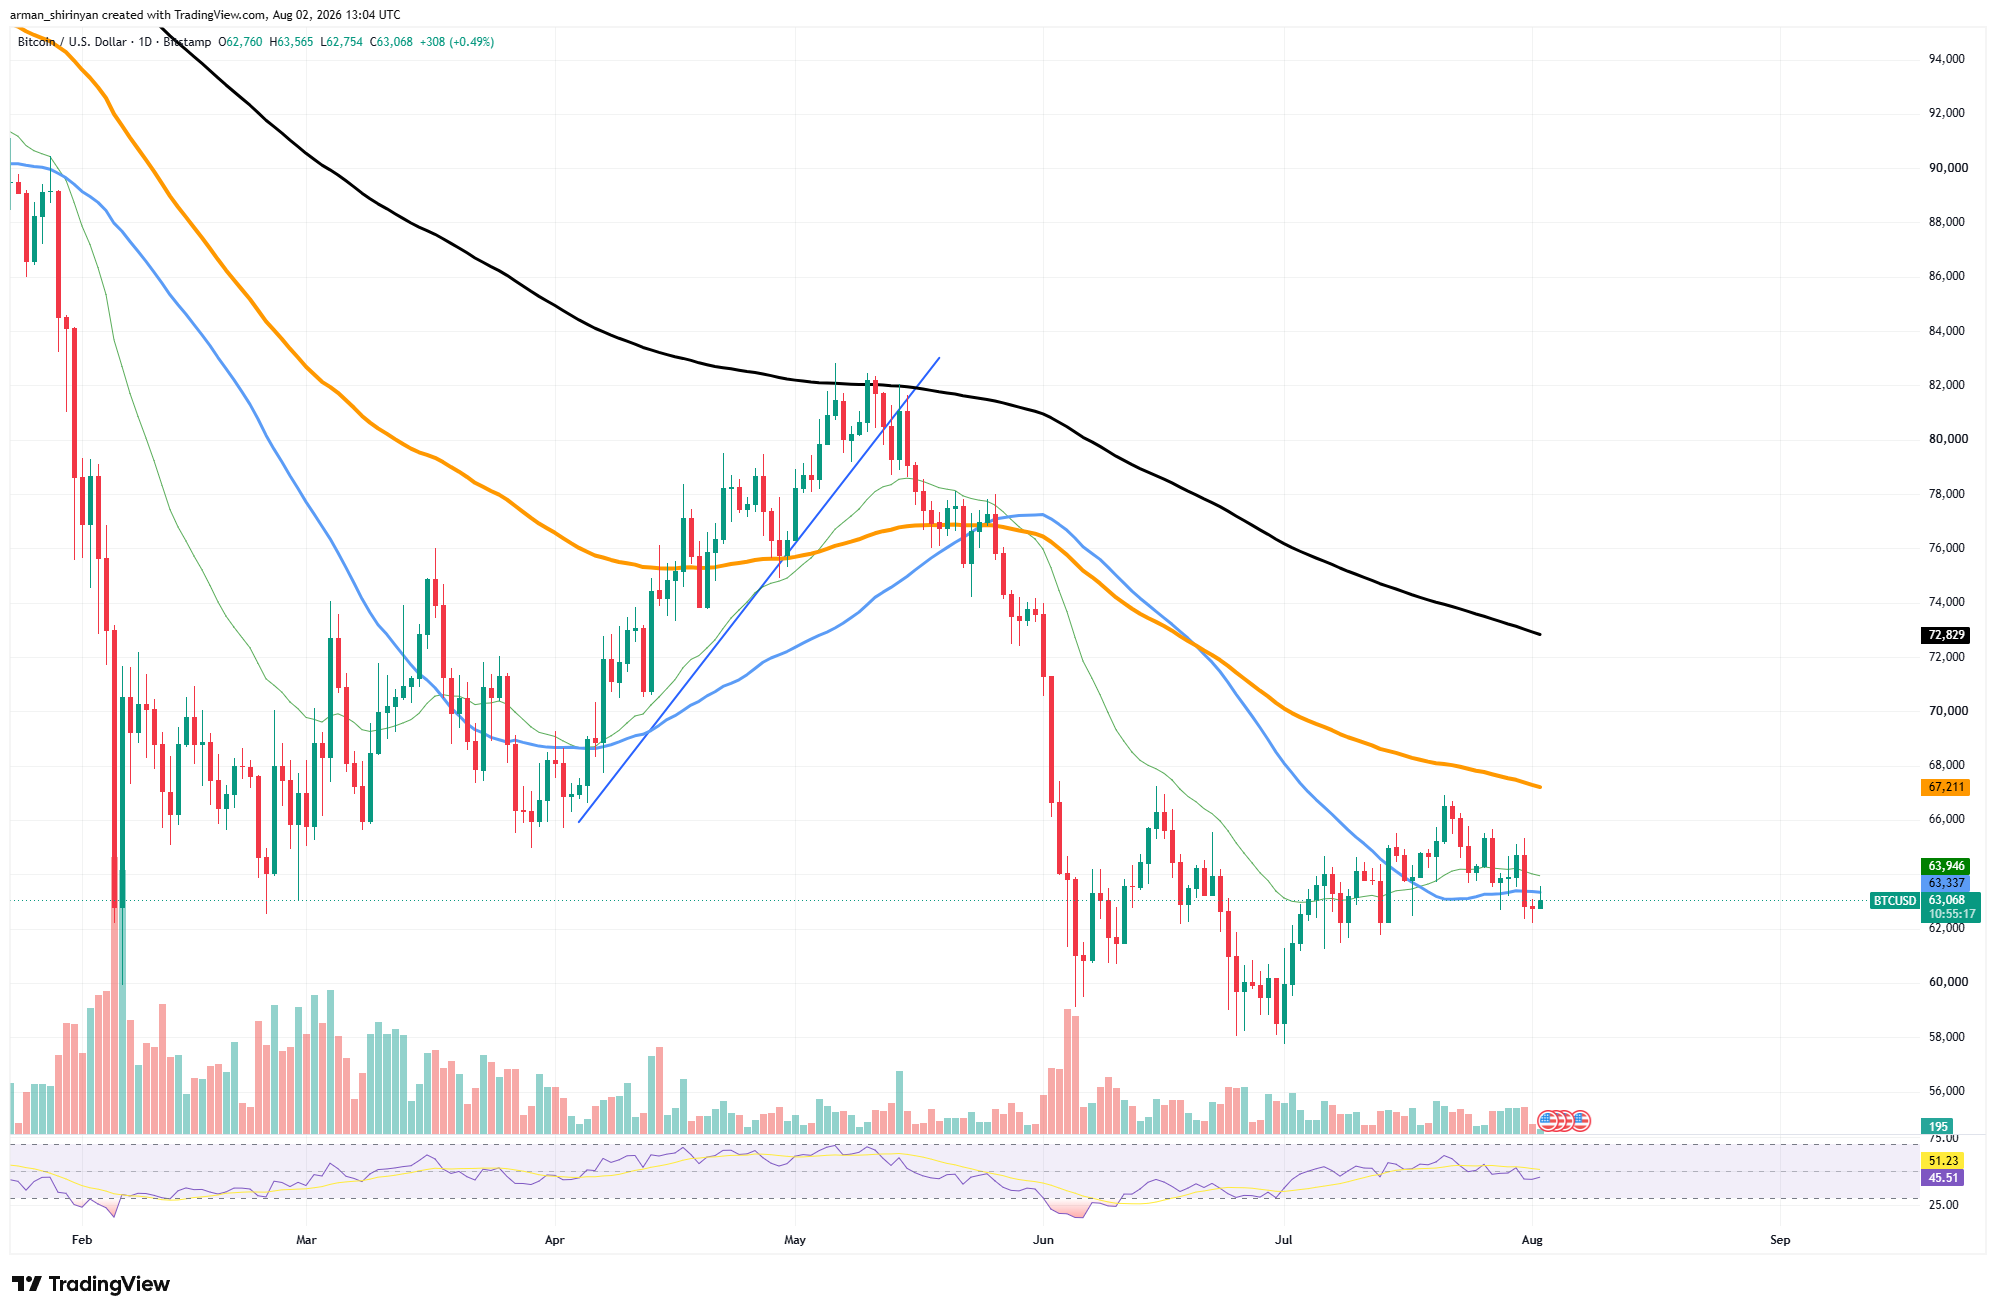
The overall picture is still difficult, though. Bitcoin is still trading below the 200-day EMA, which is close to $72,800, and the 100-day EMA, which is at about $67,200. The fact that these longer-term moving averages are still sloping downward suggests that the macro trend has not yet turned back in favor of buyers.
Additionally, volume has decreased during the current phase of consolidation. As volatility decreased, trading activity has progressively decreased rather than exhibiting accumulation. Although a larger move is frequently preceded by declining volume, there is currently little indication on the chart regarding the potential direction of that breakout.
A neutral market with no significant buying or selling extremes is reflected by the Relative Strength Index, which is currently at 46. This is consistent with Bitcoin’s fluctuations over the previous month. Around $67,000, the 100-day EMA continues to be the main barrier.
Regaining that level would enhance the technical outlook for Bitcoin and might inspire another attempt to reach the 200-day EMA around $73,000. Recovering above both moving averages would be the first significant indication of a trend reversal since the correction started.
Support is still concentrated between $62,000 and $63,000, where buyers have frequently found Bitcoin in recent weeks. The market would probably experience another drop towards $60,000, a level with both technical and psychological significance, if that zone were lost. Bitcoin is currently stuck in a consolidation phase.
Cardano’s return potential
Cardano has had one of its best daily results in weeks, rising by almost 9% to trade at about $0. 19. After months of continuous weakness, the rally lifted ADA above both its 50-day and 100-day EMAs, which is a positive technical development. But the action has put the asset squarely in a significant resistance area, which may decide whether or not this recovery can continue.
The 200-day EMA, which is close to $0. 197, is currently the most significant barrier. This moving average has historically served as a boundary between long-term bullish and bearish trends, and ADA is currently testing it for the first time since the June decline. The technical outlook would be greatly improved by a decisive daily close above that level, which might lead to more buying from traders awaiting trend confirmation.
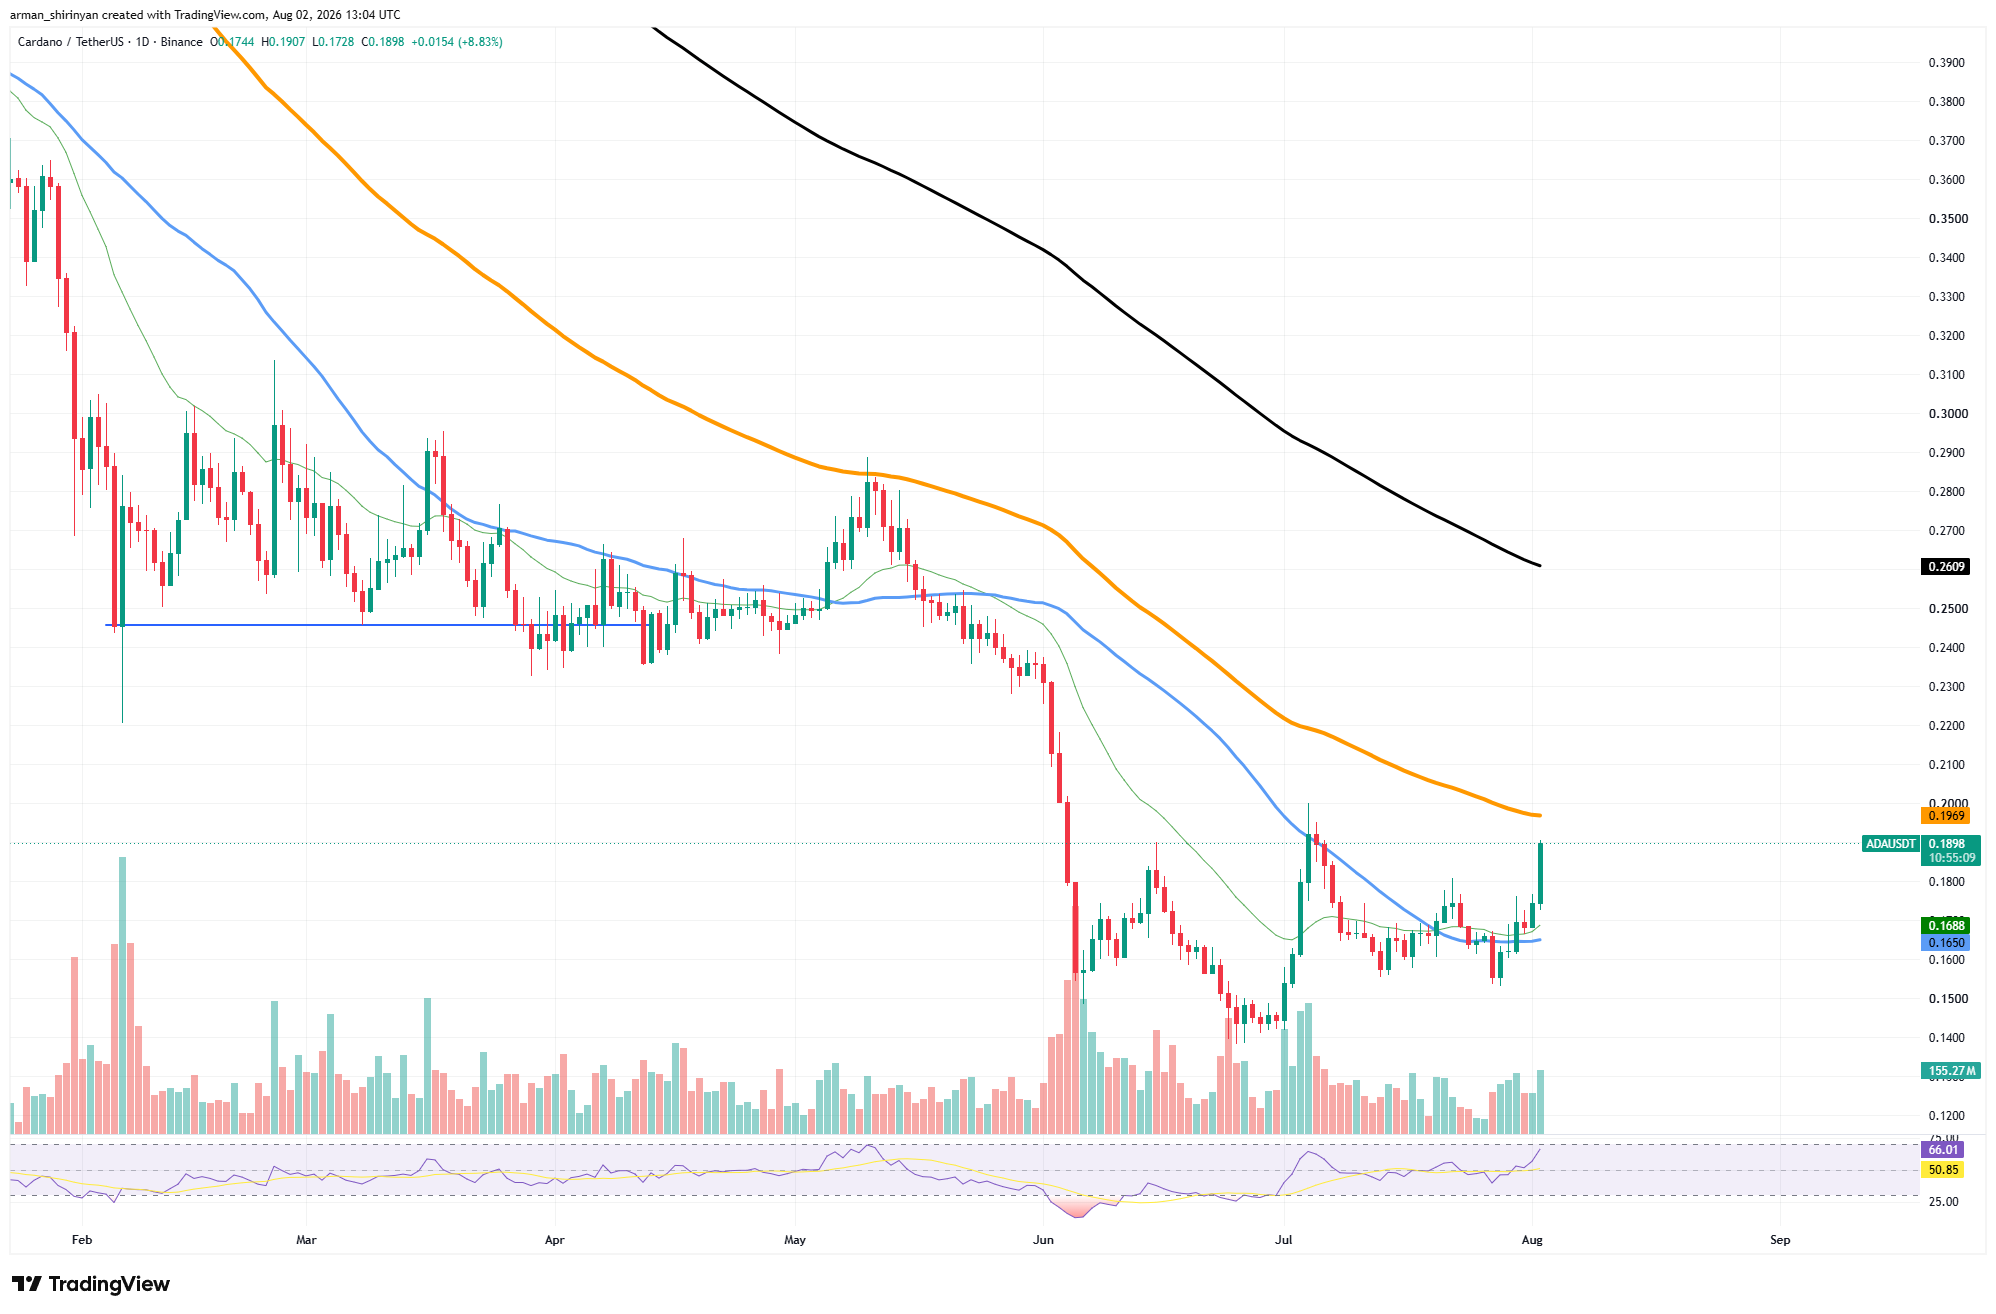
During the rally, trading activity increased significantly, indicating real participation rather than a low-volume price spike. Additionally, momentum has increased; the Relative Strength Index has risen to about 66. Even though that is getting close to overbought territory, there is still time for another leg higher before buyers give up. Still, traders need to exercise caution.
Even though ADA has recovered its shorter-term moving averages, it is still in a wider downtrend over the longer time frame. The current rally may simply turn into another lower high within the longer bearish structure if bulls are unable to close above the 200-day EMA. The first significant support on the downside is now the recovered $0.168-$0.170 region.
The bullish structure created during the breakout would be maintained by holding above that area. ADA would probably return to the mid-$0. 15 range if it lost it. As of right now, buyers are clearly in the lead. Whether Cardano is starting a true trend reversal or just staging another relief rally inside a much larger bearish cycle will be determined by the next few daily candles.
Solana’s attempt to gain foundation
Solana has stabilized at $73, but it still faces long-term resistance. The asset is still trapped between close support and a group of moving averages that consistently cap each attempt at recovery after several weeks of sideways trading. In a technical sense, the situation is still unclear.
SOL is trading near the 50-day EMA and below both the 100-day EMA at $75 and the 200-day EMA at $79. This arrangement implies that buyers have not yet created enough momentum to establish a sustained uptrend, even though selling pressure has decreased since June. Growing uncertainty is also reflected in price action. Solana developed a tightening consolidation pattern with lower highs and comparatively stable support over the previous few weeks.
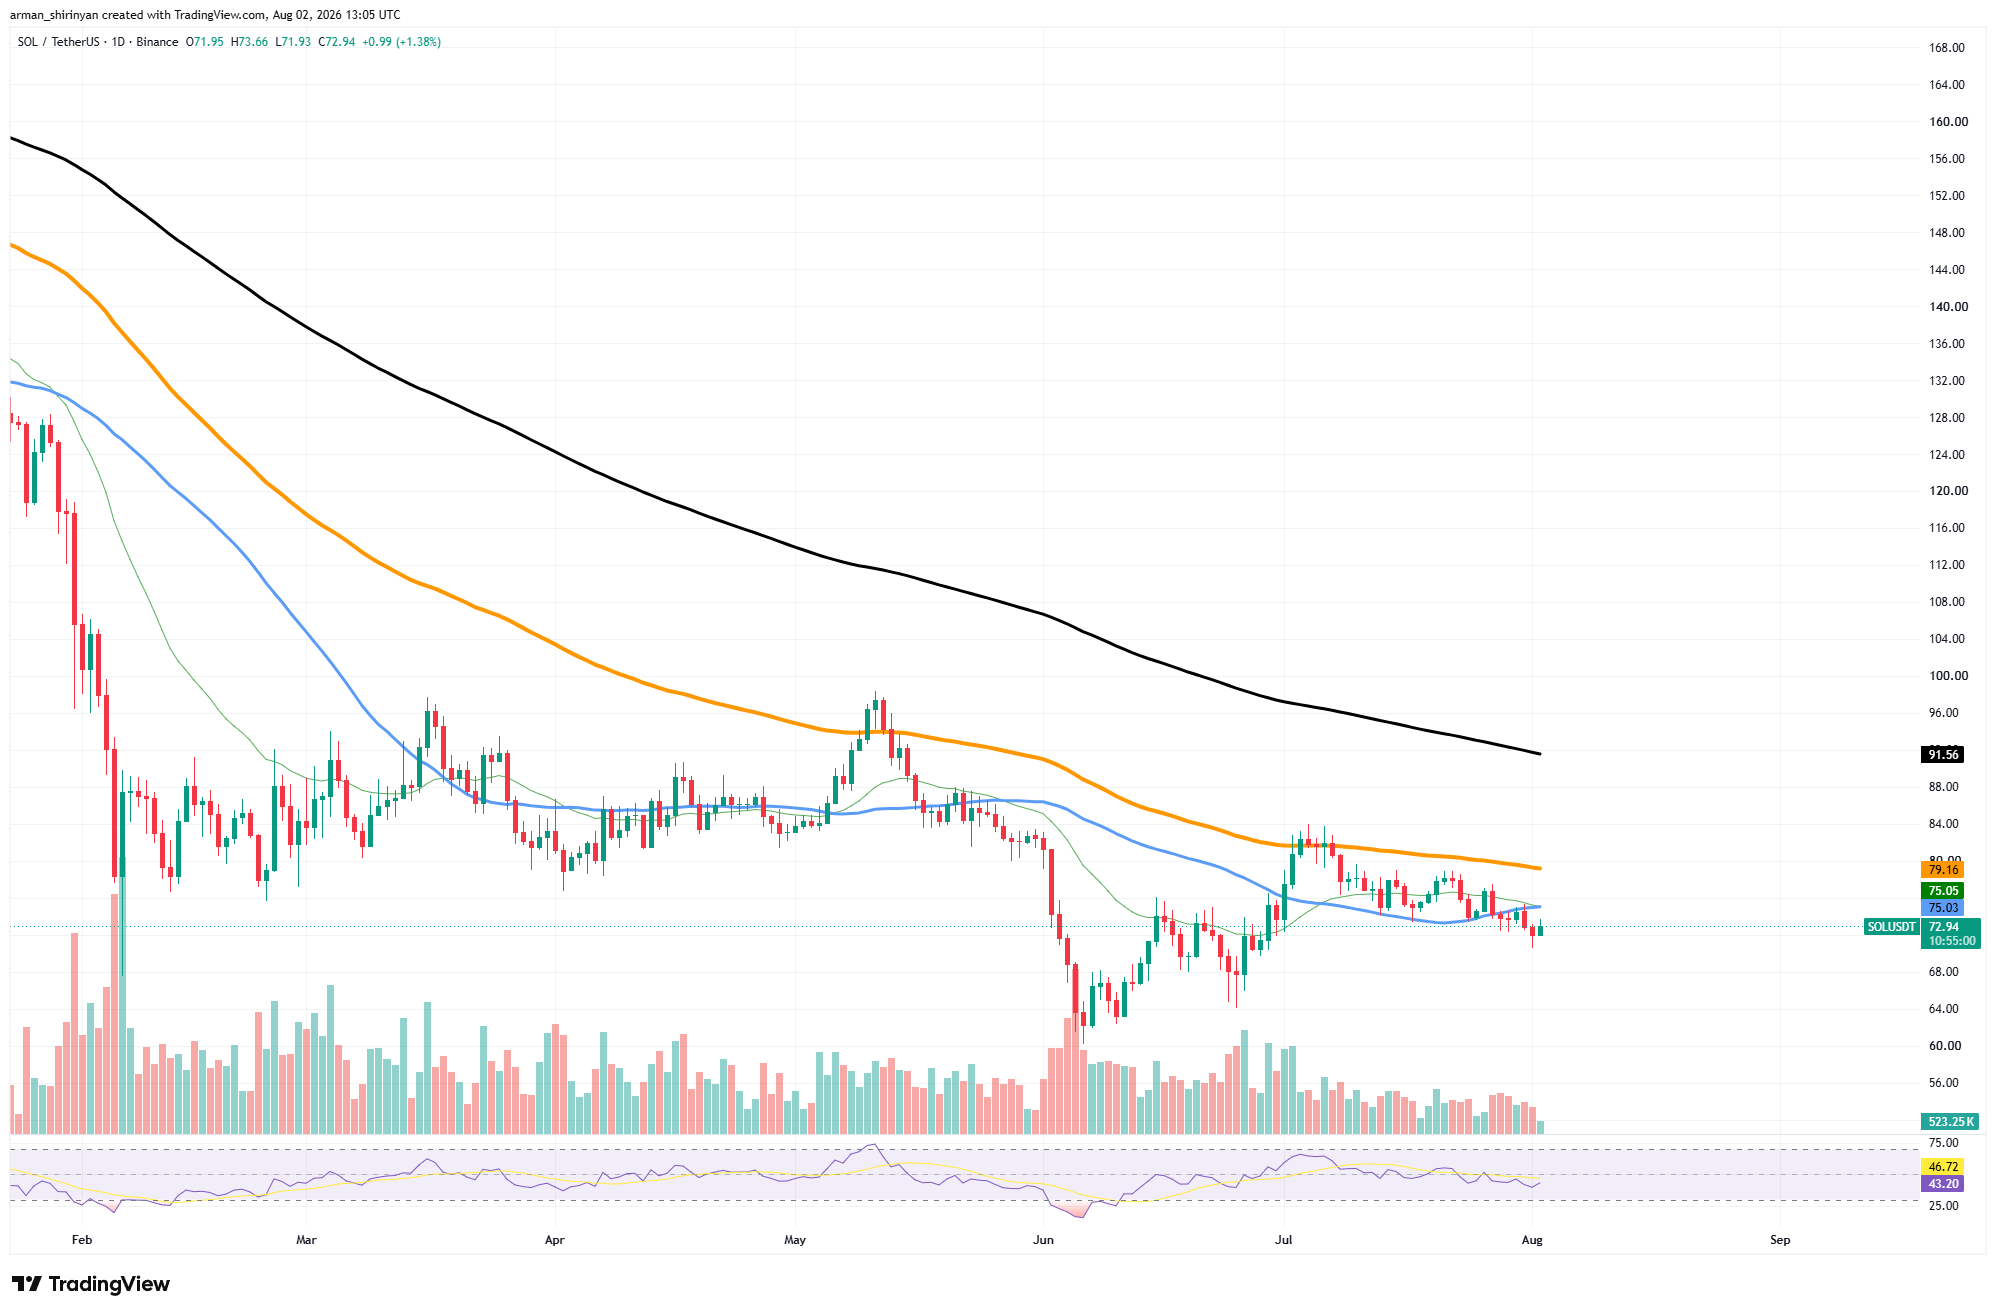
Bulls were left without a definite technical victory as the price fell below the lower trendline rather than producing a convincing breakout. Fortunately for purchasers, there hasn’t been much follow-through selling and the breakdown has stayed superficial. During consolidation, volume keeps falling, which indicates that buyers and sellers are holding off on making capital commitments until there is a stronger catalyst.
The lack of directional momentum is confirmed by the Relative Strength Index, which is firmly in neutral territory at 47. Reclaiming the 100-day EMA around $75 is the bulls’ immediate challenge.
The 200-day EMA at about $79 would come back into focus if it were to successfully move above that level. The strongest bullish signal Solana has generated in months would be the recovery of both moving averages, which could pave the way for the mid-$80 range.
Support is in the range of $71 to $72 if sellers regain control. If SOL were to lose that zone, it would probably return to its June lows and strengthen the general bearish trend that has dominated the majority of 2026. Solana is still in consolidation as of right now.
Although there hasn’t been a significant breakdown, the asset doesn’t have enough momentum to overcome long-term resistance. Sideways trading is likely to continue to be the predominant scenario until the price decisively breaks above the moving averages or below recent support.



Be the first to comment