


What to know:
- XRP slips below key support near $1.45, signaling weakening buyer control.
- Rejection at $1.52 keeps the price stuck inside a broader range structure.
- Long-term trendline still holds, leaving room for a potential recovery.


XRP is showing signs of strain across both short-term and long-term charts, as recent price action points to a possible shift in momentum. Market watcher Cryptorphic highlighted that XRP has fallen through the support line and is currently trading at levels lower than $1.45.
This places XRP back in an older trading range, which indicates that the earlier bullish setup is losing steam. A range between $1.452 and $1.465 is proving to be a significant barrier for the token.

The attention is now focused on the lower support levels. If the token is not able to hold above $1.4236, the next target will be at $1.387.
This is because more sellers are emerging, as attempts to recover what was lost are not being achieved. For now, the price action is showing indecision, but the momentum is slightly more bearish.
Also Read: XRP Crashes Below Realized Price As Bears Take Control
Range Structure Holds as Rejection Confirms Supply Zone
On the 6-hour chart, the the token is trading in a range that has been holding the prices back over the last few weeks. The top of the range is around the region of $1.48 to $1.52, which is a good place to sell, as the prices tend to fall when there is selling pressure.

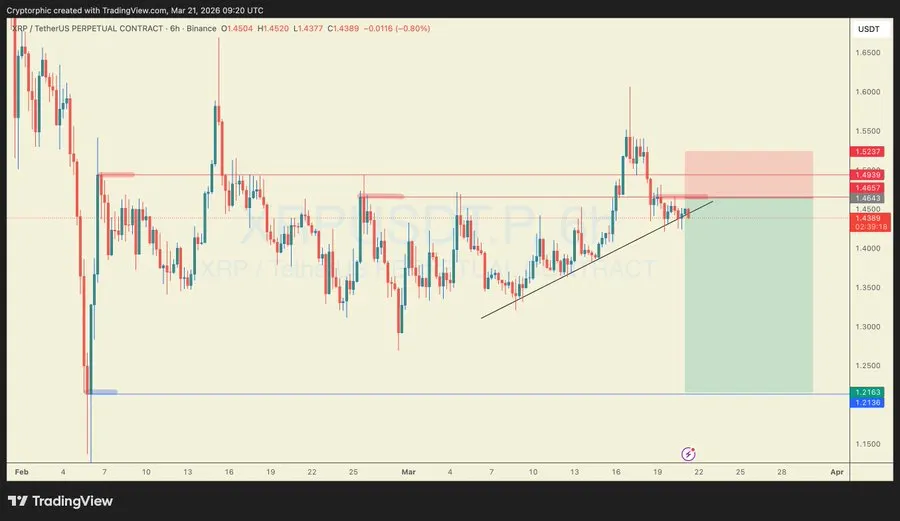
Source: X
The last time the prices attempted to rise above the range, they were immediately rejected with a wick, indicating the presence of selling pressure.
Although the prices have shown signs of strength with the formation of higher lows, the current prices appear to be in a squeeze as the prices are becoming compressed between the resistance and the upward-sloping trendline.
The current setup is a conservative one. If the price does not break through this resistance, there is a higher possibility that the price might fall back into the lower range, which is around $1.21.
The level of interest is the resistance level. If XRP approaches this level and looks weak, then another fall can be expected.
XRP Long-Term Trendline Keeps Bullish Outlook Alive
Although the signals are weak, the weekly chart shows a more stable trend. As seen in the analysis by market analyst Ali Charts, XRP still has a long-lasting uptrend line, supporting its price movement since 2020.
This uptrend line is a significant demand zone, as every touch of the trendline reignited the buying pressure of XRP. Even through volatile conditions, XRP has maintained higher lows along this support level, which indicates that the overall setup is still intact.

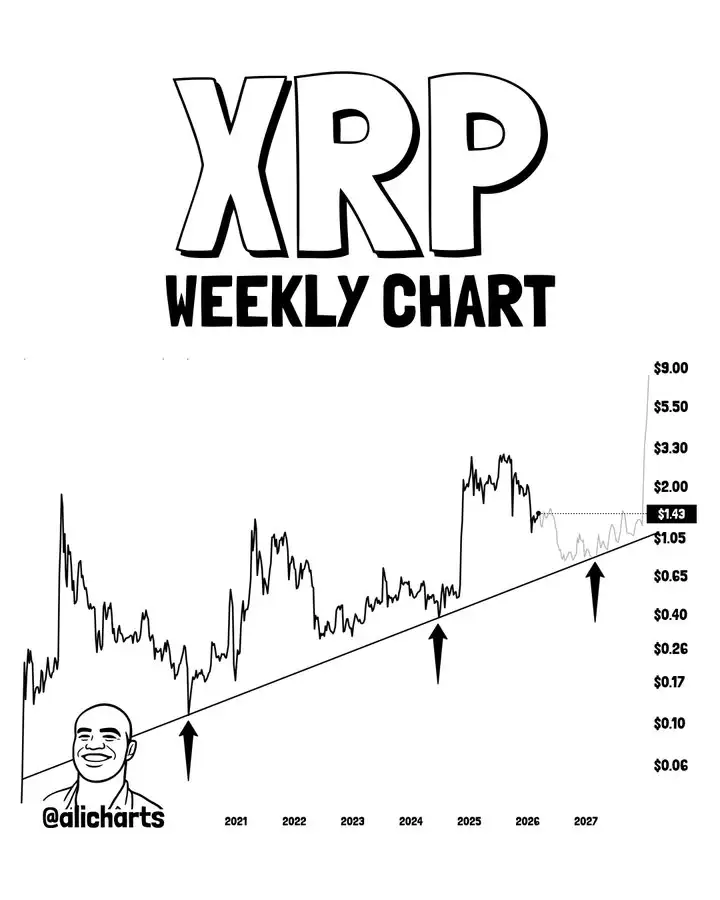
Source: X
The recent pullback towards this trendline might be another test for XRP. The $1.43 level is a significant pivot level.
Holding this level might actually assist the recovery and propel the asset towards higher levels. However, a break below this trendline would not be a positive sign.
This article contains market analysis and price predictions. These are not guarantees. Crypto markets are volatile. Always DYOR. Not financial advice.
Also Read: XRPL Adds Institutional Lending and Privacy Tools in Ripple’s 2026 Roadmap

Be the first to comment