



Here is a technical analysis of ETH/USDT on the daily timeframe:
Market Overview
Ethereum has spent the past week consolidating after its rejection at the psychological $2,000 resistance zone. Rather than extending the correction, buyers have successfully defended the $1,850-$1,860 support area for a second consecutive week, preventing a deeper decline.
At the time of writing, ETH is trading around $1,861, almost unchanged on the day. The market remains in a healthy consolidation phase, with the price repeatedly respecting the previous breakout zone. Although bullish momentum has slowed since the late-July rally, the broader daily trend continues to favour buyers as long as the current support remains intact.
Technical Analysis
Since the previous report (28 July), Ethereum has largely traded sideways between $1,850 and $1,950, reflecting a balance between buyers taking profits and sellers struggling to regain control. The most significant technical development during the week is that Ethereum has once again respected the $1,850 breakout level. The highlighted area on the chart shows multiple daily candles testing this zone, with buyers consistently stepping in to defend it. This confirms that the former resistance has now become a reliable support level.

Unlike the sharp rejection seen near $2,000 previously, the latest decline has been relatively shallow. The absence of aggressive selling suggests that market participants are accumulating rather than exiting their positions. However, there are also signs that bullish momentum has weakened in the short term:
- Daily candles have become smaller, indicating reduced volatility.
- Volume has gradually declined throughout the consolidation, showing that neither buyers nor sellers currently have strong conviction.
- Price has remained below the recent lower high around $1,930–$1,950, meaning bulls have yet to regain full control.
From a market structure perspective, Ethereum still maintains its sequence of higher lows from the June bottom. The long-term descending trendline that rejected the price near $2,000 continues to act as overhead resistance, and reclaiming this area remains the next major challenge.
The repeated defence of the $1,850 region increases the probability that Ethereum is building a base for another upside attempt rather than beginning a bearish reversal. Nevertheless, confirmation will only come once buyers reclaim the $1,930–$1,950 resistance zone with a strong daily close.
Also Read: What Are Agentic Payments? How AI Agents Are Changing Payment Systems?
Outlook
The overall daily bias remains moderately bullish, but Ethereum is currently waiting for its next move.If buyers continue defending the $1,850–$1,860 support zone, another move toward $1,930-$1,950 is likely. A successful breakout above this resistance would bring $2,000 back into focus. A convincing daily close above the psychological $2,000 level would invalidate the recent consolidation and could accelerate the next leg higher toward $2,150-$2,200.
If Ethereum loses the $1,850 support on a daily closing basis, it would signal that buyers are losing momentum. In that case, the price could revisit the next demand area near $1,750, where stronger buying interest would be expected. For now, the current consolidation appears to be a pause within the broader recovery rather than evidence of a trend reversal.
At the time of writing, ETH was trading at approximately $1,861.
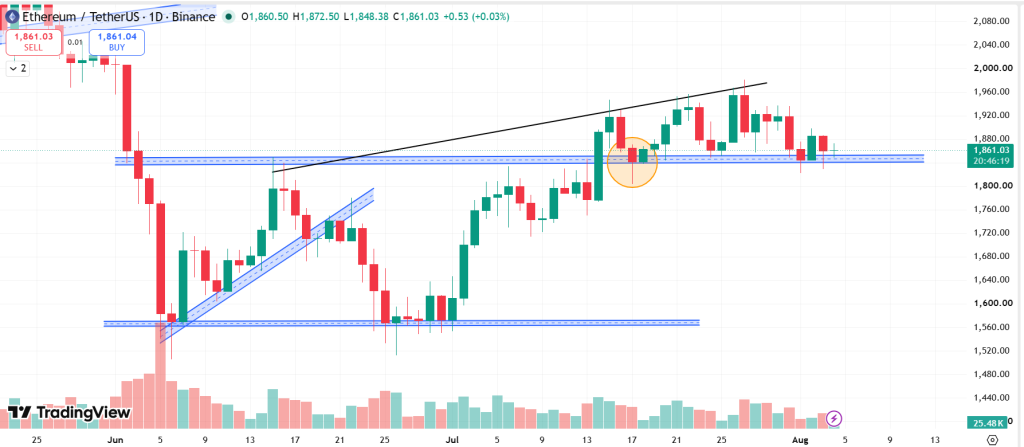
Summary: Ethereum continues to consolidate after its rejection at the psychological $2,000 resistance level. Importantly, the previous breakout zone around $1,850 has once again held as support, reinforcing the medium-term bullish structure. The price remains trapped between strong support and overhead resistance, with declining volume reflecting market indecision. As long as ETH continues to hold above $1,850, the probability still favours another attempt toward $2,000. A decisive breakout above that level would strengthen the bullish outlook considerably, while a daily close below $1,850 would shift momentum in favour of a deeper correction toward $1,750.
Support and Resistance Levels
| Support 2 | Support 1 | Asset | Resistance 1 | Resistance 2 |
| $1,750 | $1,850 | ETH | $2,000 | $2,200 |
In the grand scheme of things, ZebPay blogs are here to provide you with crypto wisdom. Get started today and join 6 million+ registered users to explore endless features on ZebPay!
Disclaimer:
Crypto products and NFTs are unregulated and can be highly risky. There may be no regulatory recourse for any loss from such transactions. Each investor must do his/her own research or seek independent advice if necessary before initiating any transactions in crypto products and NFTs. The views, thoughts, and opinions expressed in the article belong solely to the author, and not to ZebPay or the author’s employer or other groups or individuals. ZebPay shall not be held liable for any acts or omissions, or losses incurred by the investors. ZebPay has not received any compensation in cash or kind for the above article and the article is provided “as is”, with no guarantee of completeness, accuracy, timeliness or of the results obtained from the use of this information.



Be the first to comment