



What to know:
- The BNB price approaches $600 as analysts identify strong resistance between $600 and $605.
- A confirmed close above $600 could open the way toward the $615–$620 resistance zone.
- BNB remains below the 100-day and 200-day EMAs despite improving short-term momentum.

BNB price approached a key psychological barrier on Wednesday, August 5, 2026, as higher lows and improving momentum strengthened bullish expectations. However, multiple resistance zones and the broader bearish EMA structure continued to prevent confirmation of a sustained breakout.
At the time of writing, Binance Coin (BNB) is trading at $593.69, marking an increase of 0.47% in the past day. The trading volume is down by 6.64% and is currently standing at $946.57 million. Over the last week, the BNB price has gone up by 4.41% according to CoinMarketCap.
Also Read: XRP Price Eyes $3.50 High as Bullish Breakout Meets Rising ETF Inflows

How Bulls Could Push BNB Price Toward the $615–$620 Target
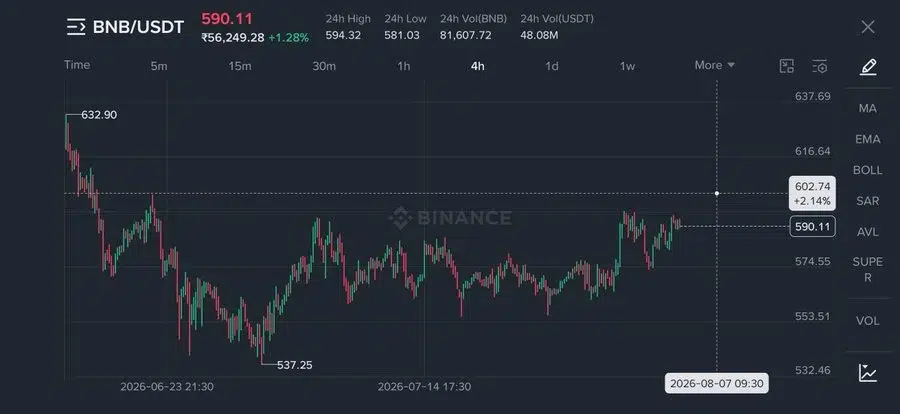
Crypto analyst Aman Sai noted that BNB was approaching $600 after reclaiming key support, with bulls gaining momentum below the major psychological level. He identified resistance between $600 and $605 and support between $582 and $585.
According to Sai, a confirmed four-hour close above $600 could open the way toward $615–$620. Otherwise, BNB may retest the $582–$585 support zone before attempting another breakout. He added that the next few candles could determine its short-term direction.
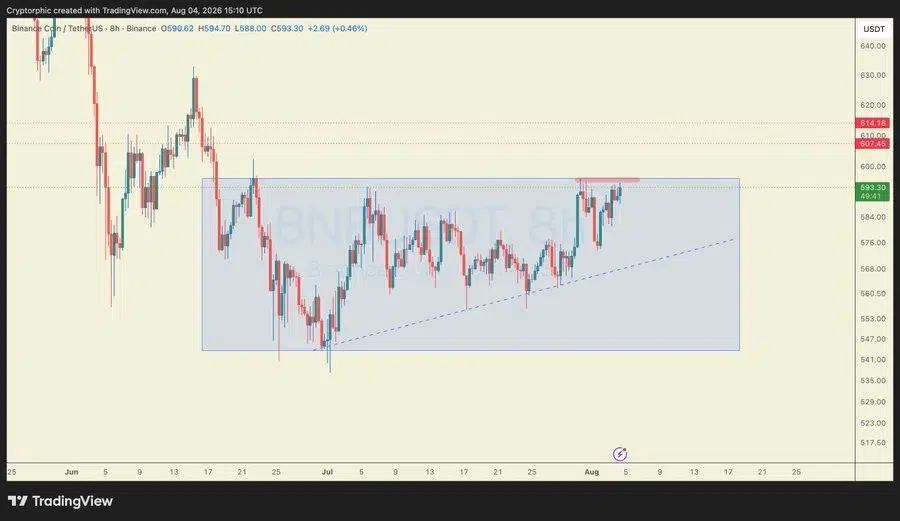
Moreover, another analyst, Cryptorphic, identified another resistance zone between $596 and $598 following weeks of range-bound trading. According to the analyst, buyers have continued to form higher lows, although the same resistance zone previously rejected several rallies.
A clean breakout and close above that range could open the way toward $607 to $614. Until then, the analyst considers it a key decision area for the token’s next move. Both forecasts show that BNB remains below the levels needed to confirm a breakout.
What EMA and RSI Indicators Reveal About BNB Price
According to TradingView data, the 20-day EMA stands at $579.02 and the 50-day EMA at $583.22. This position signals improving short-term momentum, although the 20-day EMA remains below the 50-day EMA, showing that a bullish crossover has not yet formed.
The price remains below the 100-day EMA at $602.78 and the 200-day EMA at $649.23. Reclaiming the 100-day EMA could strengthen the recovery, while the 200-day EMA remains a major resistance level. The overall EMA structure continues to reflect a bearish, broader trend.
The Relative Strength Index (RSI) stands at 59.33, above its moving average of 51.04 and the neutral 50 level. This signals strengthening bullish momentum, while the RSI remains below the overbought threshold of 70 and above the oversold level of 30.
What Falling Futures Volume Signals for BNB Traders
According to CoinGlass data, the BNB futures volume fell 17.14% to $417.35 million. Open interest has also gone down by 0.05% to $950.80 million. The OI-weighted funding rate stood at 0.0064%.
Total liquidations reached $100,090 over the past 24 hours. Long liquidations accounted for $24,710, while short liquidations reached $75,380. Shorts were about three times larger than longs as the BNB price increased during the measured period.
Also Read: Arbitrum Adds USDC Collateral for Ondo Perps With $5B Volume
This article contains market analysis and price predictions. These are not guarantees. Crypto markets are volatile. Always DYOR. Not financial advice.


Be the first to comment