



In this week’s Bitfinex Alpha we argued that the bitcoin narrative lies in how the broader market responds to key levels. Isolated short-term price moves carry less signal.
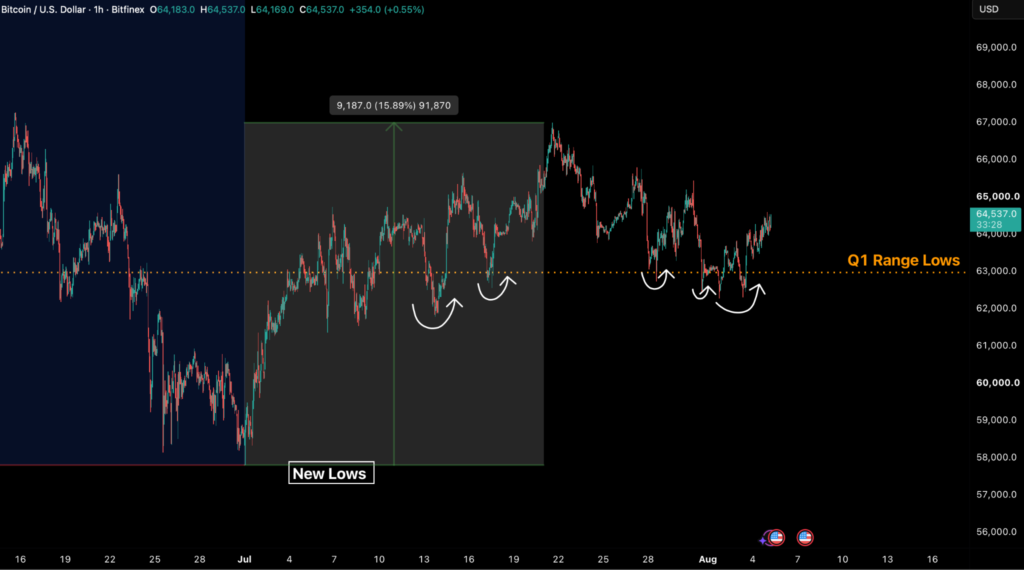
One of the outlined bearish triggers was hit, with successive daily closes dipping below the $63,000 mark. Even so, the follow-through proved fleeting. Since July, bitcoin has recorded its seventh break of the Q1 range lows at $63,000. As before, it reclaimed the level almost immediately. These repeated moves underscore a broader theme. Without a strong catalyst, the market stays illiquid on low spot volumes and stuck within our established $62,000–65,000 range. This zone is critical, holding the highest concentration of cost-basis, according to the UTXO Realised Price Distribution.
While macro developments and bitcoin’s underperformance compared with the Nasdaq and S&P 500 signal underlying stress, a genuine breakdown requires something more forceful, followed by volume-supportive price action. For now, volumes cluster in the middle of the range and thin out near the extremes. Taker volume especially is a sign that neither side is pushing hard to break the range in either direction.
The Marginal Seller Steps Forward
The most important seller of the week was Strategy. Strategy’s 8-K, published on Monday, disclosed the sale of 1,638 BTC for $104.73 million, an average just under $64,000, taking holdings to 842,138 BTC. The mechanics explain the motive.

With STRC preferred shares trading near $89 against their $100 stated value, the company spent $81.2 million buying them back, sold $290.6 million of common stock and lifted its dollar reserve to $4 billion. While its preferred trades below par, the treasury flywheel runs in reverse. The largest corporate holder of the last two years is now a net seller, extending the Monetization Program sales first disclosed in its Q2 report. Strategy is still authorised to sell more than $4.6 billion of bitcoin on an as-required basis under its $5 billion BTC sale authorisation. The company can now use the dollar reserve to cover the preferred stock dividends for two years and four months.
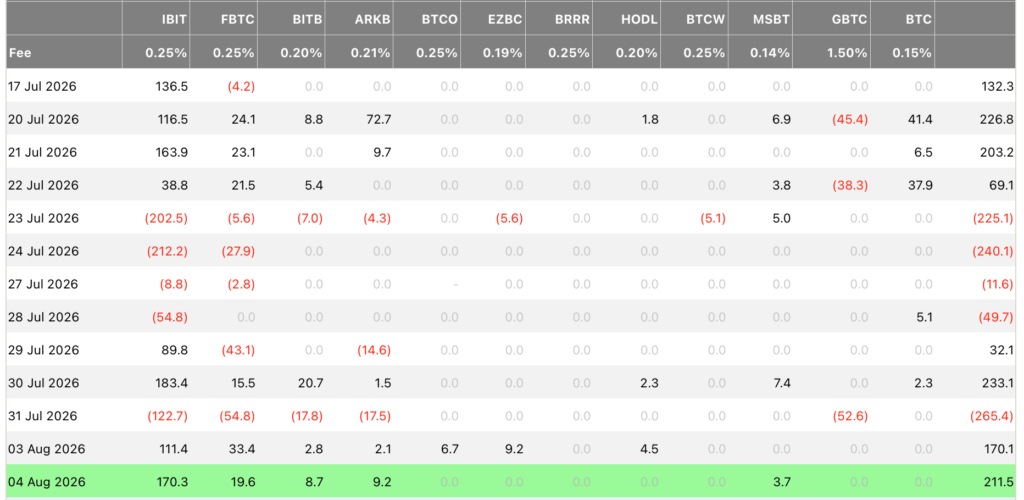
The tape’s response is the evidence that matters for traders. On the day of the disclosure, bitcoin dipped to $62,305 and closed at $63,543, then rose again on Tuesday. The spot Exchange Traded Fund (ETF) complex, which had just printed its first net-negative week in a month, returned $170.1 million of inflows on Monday, led by BlackRock’s IBIT at $111.4 million and Fidelity’s FBTC at $33.4 million followed by $211 million on Tuesday, of which IBIT took $170.3 million.
Across just two sessions this week, the ETF bid covered the disclosed corporate supply 3.6 times over. Ether ETFs gave back $11.9 million on Monday before a $53 million inflow on Tuesday, pausing a three-week stretch in which they had outpaced the bitcoin ETF complex while showing resilience.
Derivatives Are Pricing More Range
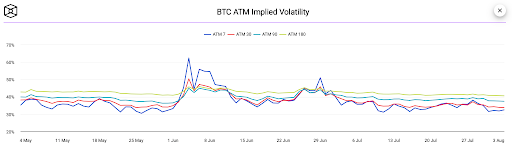
Positioning data shows neither side paying for a resolution in either direction at current prices. Perpetual funding averaged 0.0031 percent per eight hours from 1 to 5 August, with the latest prints at exactly zero, so neither side is aggressively positioning in perpetual contracts after the range low held. Implied volatility (IV) across all expiries has drifted lower, and both call and put premiums have fallen back to multi-month lows. The 30-day IV eased from 37.2 to 33.7 over the past week. Volatility sellers collected premium as price retested the $62,000 region, and the trade paid off: realised movement stayed inside the zone.
Where traders are paying up, the date and direction are specific, with a relative premium still attached to downside protection. On the 28 August monthly expiry, the $60,000 put trades at 39.1 percent implied volatility against 31.3 percent for the roughly equidistant $68,000 call. That 7.8-point downside premium has widened from about 6.3 points at the August open. Open interest in the $60,000 puts alone stands at 1,916 BTC.
The market is buying protection against a September-shaped downside resolution of the range while paying nothing for an upside one.
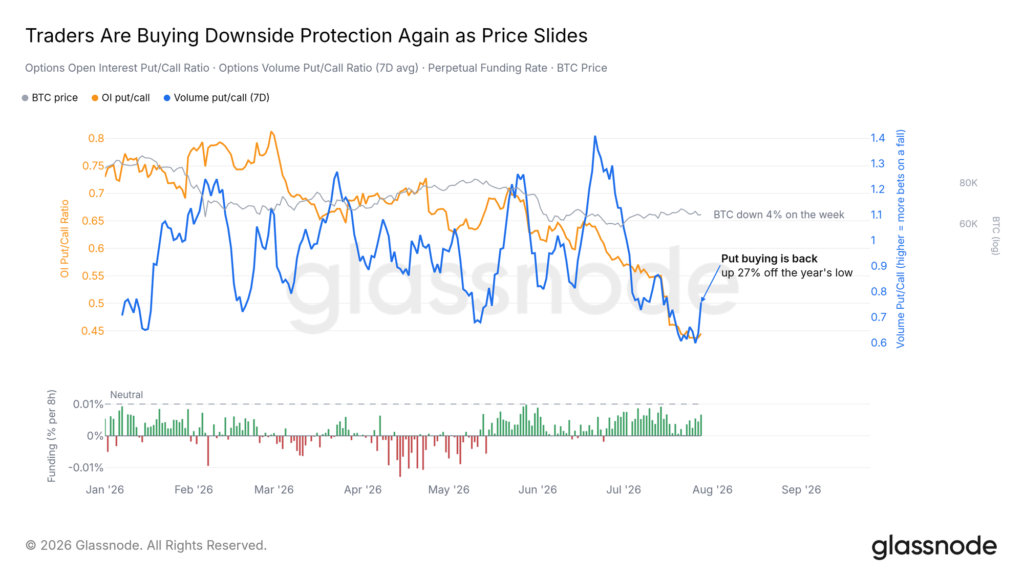
Options traders are effectively pricing in a continuation of the range and, on aggregate, hedging for a downside resolution of it several weeks from now. Skew has drifted upward from its recent floor, mirroring a shift in market flows: after hitting a yearly low, the volume-based put/call ratio has spiked in tandem with the recent price decline heading into August, while perpetual funding rates have stayed suppressed throughout the month. This lines up with the “volatile August” thesis, after the constructive July thesis played out.
A more tempered outlook sits in the open interest data. Although the open interest put/call ratio appears to have bottomed at the same time, it has shown a slower recovery from those lows. Until this uptick turns into a more significant reversal, the current activity suggests tactical repositioning in the short term rather than a decisive shift towards expecting immediate downside.
CME futures tell the institutional version of the same story. With open interest still near its 2023 lows around 100,000 BTC at an annualised basis below five percent, the carry trade is still unavailable, giving traditional finance desks no reason to engage a rangebound asset.
Decoupling From Equities Intensifies
Despite BTC holding range lows and equity indices moving higher on Tuesday, macro has provided headwinds to risk assets. July’s Institute for Supply Management (ISM) Manufacturing Purchasing Managers’ Index (PMI) printed 55.6, its highest reading since May 2022, with the employment index expanding for the first time in 33 months.
Market-implied odds of a September rate hike climbed to roughly 65 percent by Tuesday, up from the high-50s after the July meeting. The 10-year Treasury yield closed July at 4.75 percent, its highest since January 2025, before easing to 4.70 percent on Monday, with the 30-year at 5.23 percent. Equities absorbed the same news in stride. The S&P 500 opened August with a 1.5 percent gain on Monday, followed by a 1.79 percent increase on Tuesday.
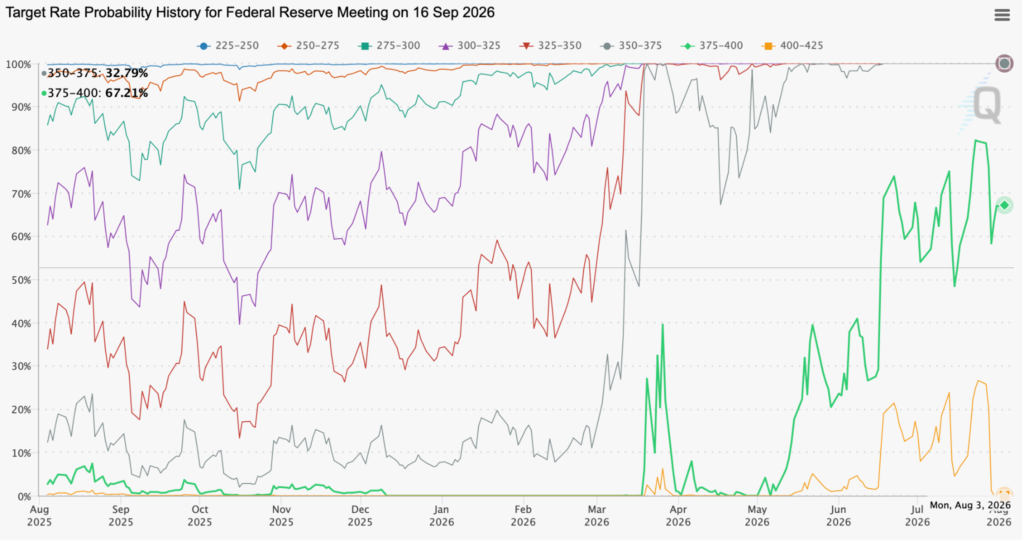
Set against that backdrop, bitcoin’s behaviour extends the decoupling flagged last week, now in the opposite direction. Last week bitcoin fell 2.5 percent while the Nasdaq and S&P 500 rose; this week it recovered while hike odds climbed. A tape that moves against the rates trade in both directions signals that the governing force for bitcoin sits in crypto-native positioning, exactly what the flow and on-chain data above describe.
Key Metrics Across the $62-65,000 Range
| Metric | Reading | Bullish Signal | Bearish Signal |
| Range $62,000-$65,000 | Seventh $63,000 break-and-reclaim since July | Acceptance above $65,000 on volume | Volume supported close below $62,000 |
| STH cost basis | $68,071 | Acceptance above $68,300 | Rejection at first test |
| ETF flows | +$381.6m Mon-Tue after first red week in four | Full green week, IBIT positive | Renewed redemption streak |
| Supply in profit | 55.9% (4 Aug) | Holds above 55% on retests | Sustained return below 50% |
| 28 Aug options skew | ~7.8 pts put premium, widening | Narrows toward flat post-NFP | Widens further with volatility bid |







Be the first to comment