



Published: Aug 05, 2026 at 18:48
Updated: Aug 05, 2026 at 18:58

Bitcoin’s (BTC) price has failed to rise above the $67,000 barrier, resulting in a drop below the $62,000 support.

BTC Price Long-Term Prediction: Ranging
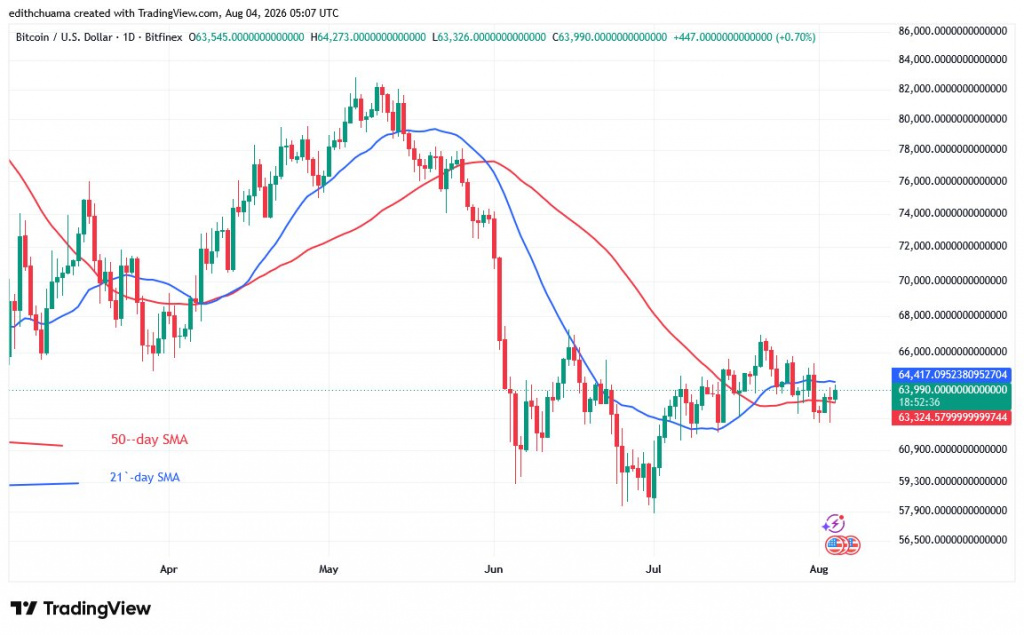
Yesterday, the BTC price is correcting upwards, although the move has been hampered by resistance at the 21-day SMA. The cryptocurrency has been stuck between support at the 50-day SMA and resistance at the 21-day SMA. For the past five days, price movement has been confined within this range.
On the upside, BTC’s price is being rejected at the 21-day SMA level. Bitcoin will resume its upward trend if it breaks above the 21-day SMA barrier. If the largest cryptocurrency breaks through this barrier, it will retest its prior high of $67,000. On the downside, if Bitcoin loses support at the 50-day SMA, it will fall towards the $60,000 level.
Technical indicators:
-
Key supply zones: $120,000, $125,000, $130,000 -
Key demand zones: $80,000, $75,000, $70,000
BTC Price Indicator Analysis
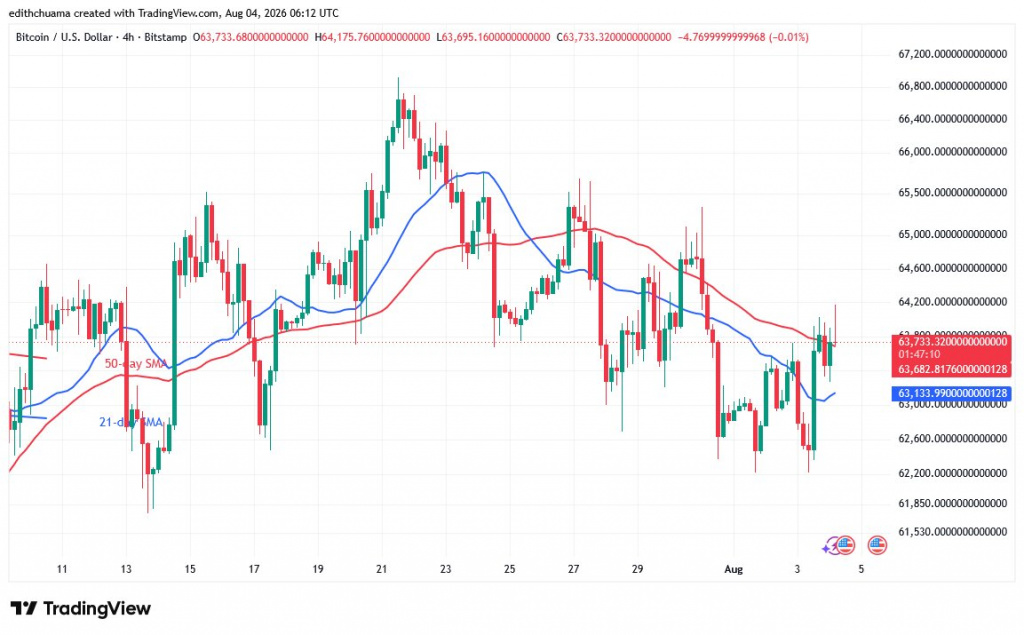
Bitcoin is struggling to stay above support at the 50-day SMA as it faces rejection at the 21-day SMA barrier. Horizontal moving average lines indicate a sideways trend. On the 4-hour chart, the 21-day SMA is below the 50-day SMA in a downtrend, reflecting the current decline.
What Is the Next Move for BTC?
BTC price movement has been trapped between support at $64,580 and resistance at $65,011. The price is currently caught between the moving averages, with the cryptocurrency struggling to break out of this range. The price movement will be determined by a break below or above the moving averages.
Disclaimer. This analysis and forecast are the personal opinions of the author. The data provided is collected by the author and is not sponsored by any company or token developer. This is not a recommendation to buy or sell cryptocurrency and should not be viewed as an endorsement by Coinidol.com. Readers should do their research before investing in funds.



Be the first to comment