




TLDR
- XRP fell 1.29% to $1.0476 on August 6, breaking below a key triangle support pattern
- The Bollinger Band lower boundary at $1.0362 is now the last technical floor before the $1 level
- Spot XRP ETFs recorded $3.58M in outflows on August 5 — the first negative session since July 8
- Derivatives data shows longs absorbed $5.92M in liquidations versus just $120K for shorts
- Analyst ChartNerd flagged August as historically the weakest month for XRP, calling any late-month decline a buying opportunity
XRP dropped 1.29% to $1.0476 on August 6, its fourth consecutive losing session. The token traded within a 24-hour range of $1.04 to $1.07, with its market cap sitting near $65.5 billion.
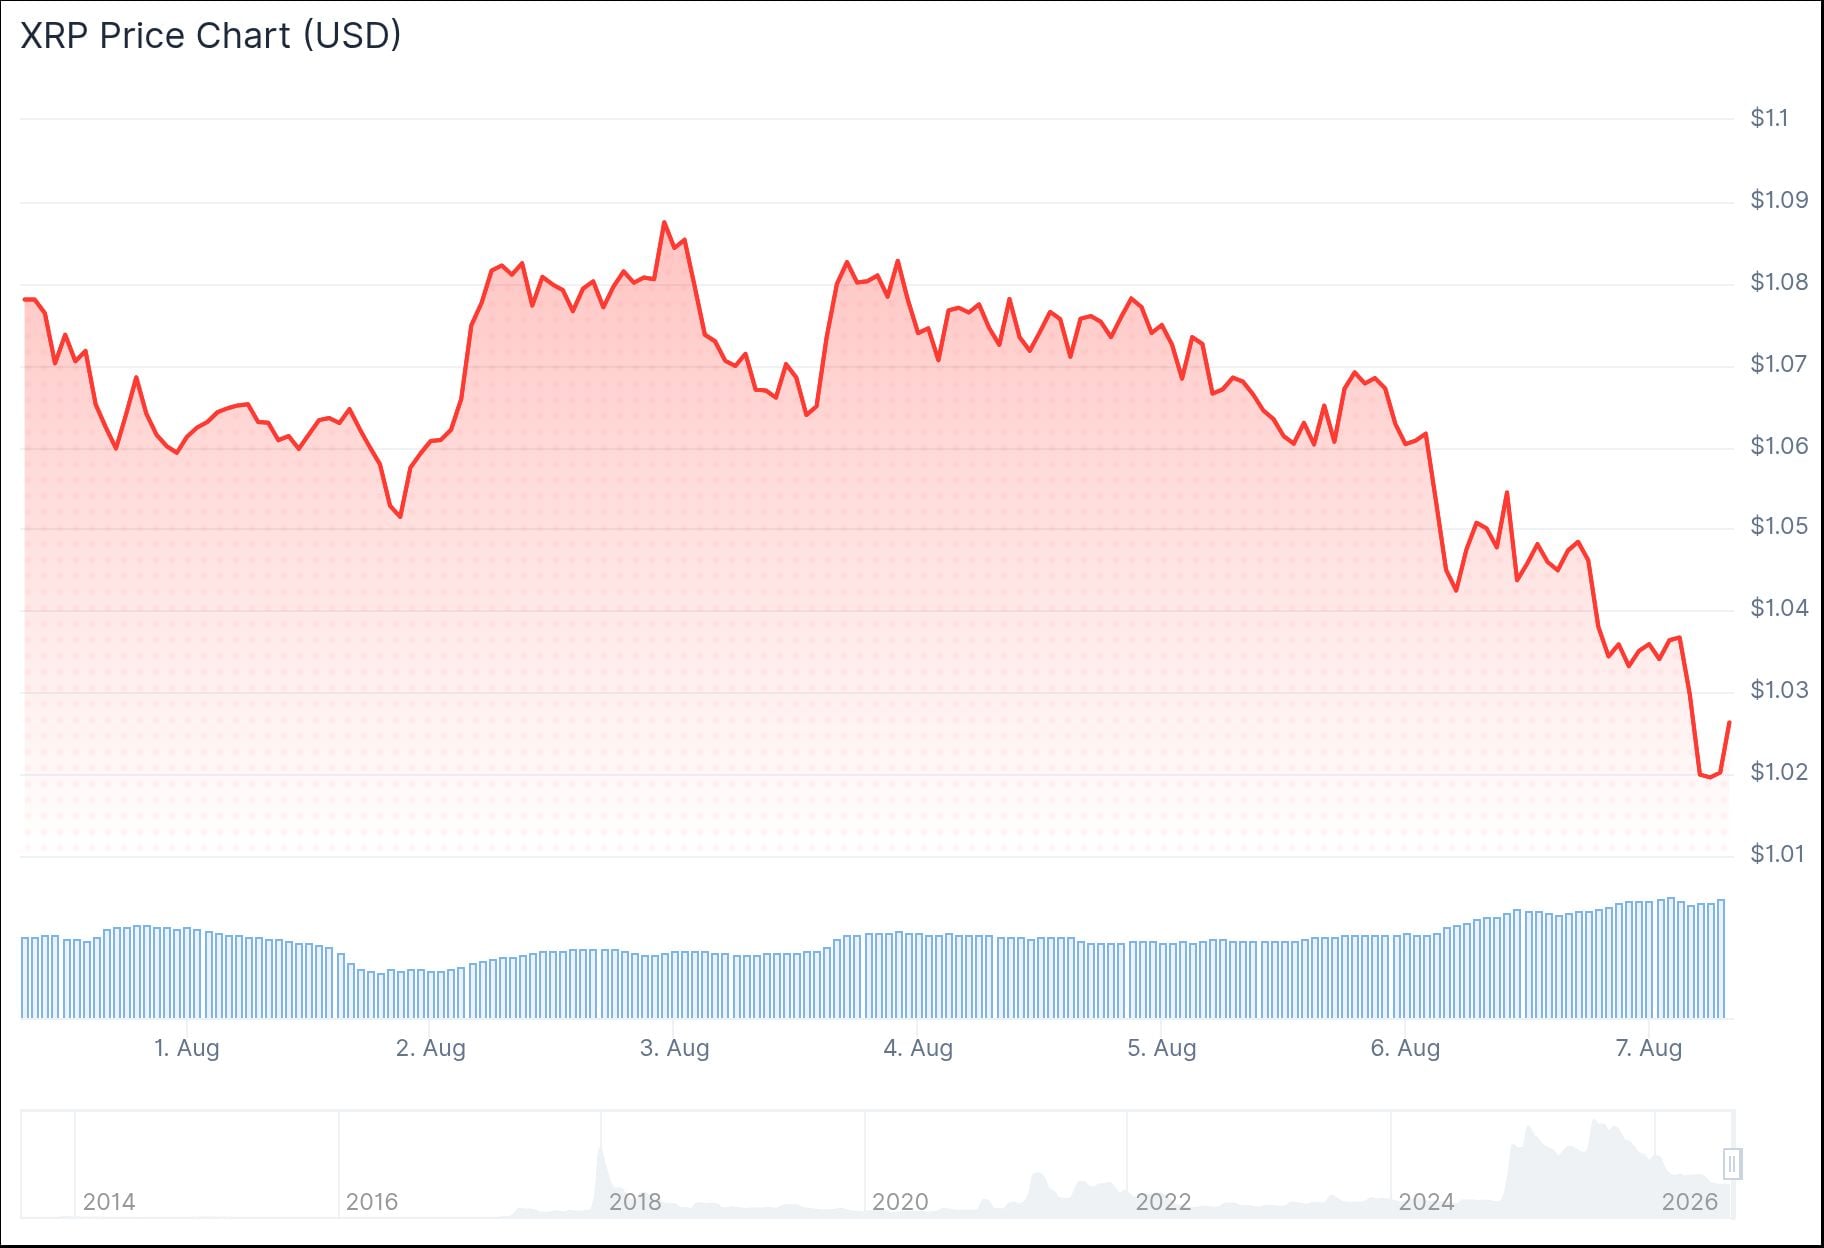
The price sits roughly 71% below XRP’s all-time high of $3.65 set on July 17, 2025. That decline has put the token under increasing pressure at a key psychological level.
The daily chart shows XRP breaking below the lower trendline of a triangle pattern that had been forming since May highs above $1.50. Both trendlines had been converging for months, and August 6’s session broke the lower support line.
The Bollinger Band lower boundary at $1.0362 is now the only technical floor standing between current price and the $1 round number. A daily close below that level would put $1 directly in play.
ETF Outflows Add to Bearish Pressure
Spot XRP ETFs recorded $3.58M in net outflows on August 5 — the first negative day since July 8. Bitwise’s XRP product absorbed the entire outflow. All other products recorded zero flow.
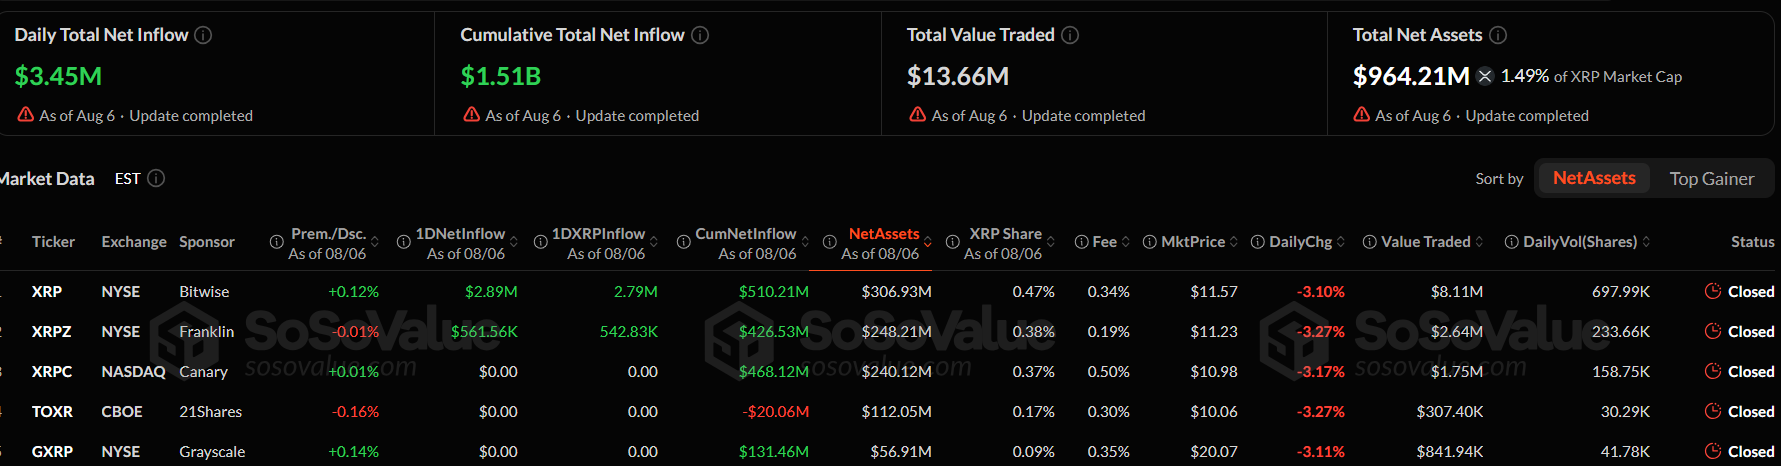
Cumulative net inflows across all five ETF products remain at $1.51B, with total net assets at $993.38M. The single-day outflow follows several weeks of muted but positive flows through July.
The RSI sits at 39.47, below its moving average of 44.14. The MACD line is also negative, showing downside momentum remains active.

Analyst Takes and Derivatives Data
Analyst EGRAG CRYPTO described $1.05 as support but “not confirmation,” placing $1.11 as the first sign of strength. A full-bodied three-day close above $1.50 would offer stronger evidence of a bottom forming.
#XRP 3-Day – Symmetrical Triangle Chart – Do you still remembered it:
💡As you can see that the bearish roadmap has largely played out in this Chart:
👉Multiple gravestone doji rejections
👉Breakdown below the triangle structure
👉Continued compression near $1.05
👉A… pic.twitter.com/zCSYhD9fCA— EGRAG CRYPTO (@egragcrypto) August 6, 2026
Analyst ChartNerd posted on X that August historically holds “the longest consecutive active losing streak of any calendar month.” ChartNerd noted that XRP frequently prints local lows between June and August before a post-summer rally, and said any bearish close in the final weeks of August “represents further opportunity.”
Now is the time to pay attention.$XRP enjoys printing local lows or cycle bottoms between June-August before witnessing a post-summer rally ☀️
June is a poor performing month in bears, July is typically a relief month, while August holds the longest consecutive active losing… https://t.co/ZwjYttCDQt pic.twitter.com/H0efBp2rkg
— 🇬🇧 ChartNerd 📊 (@ChartNerdTA) August 6, 2026
Derivatives volume jumped 51.62% to $2.06B. Longs were liquidated for $5.92M against just $120K for shorts over 24 hours.
21Shares, sponsor of the TOXR XRP ETF, intends to enter a new FTSE benchmark agreement around August 24 and end its CF Benchmarks agreement on August 31.



Be the first to comment