



On 30 July, BAE Systems released its first-half 2026 results: sales increased by 9% to £15.8 billion, underlying operating profit rose by 11% to £1.7 billion, and underlying earnings per share climbed 13% to 38.9 pence. The company upgraded its full-year guidance for sales, underlying operating profit and underlying EPS, highlighting a record order backlog of £84 billion following £16.4 billion in new contracts. On the same day, the FTSE 100 reached a new intraday high, supported by mining companies amid rising commodity prices, as well as industrial firms following strong earnings results. The move coincided with escalating tensions surrounding Iran and expectations for the Bank of England’s interest rate decision.
Technical Analysis of FTSE 100
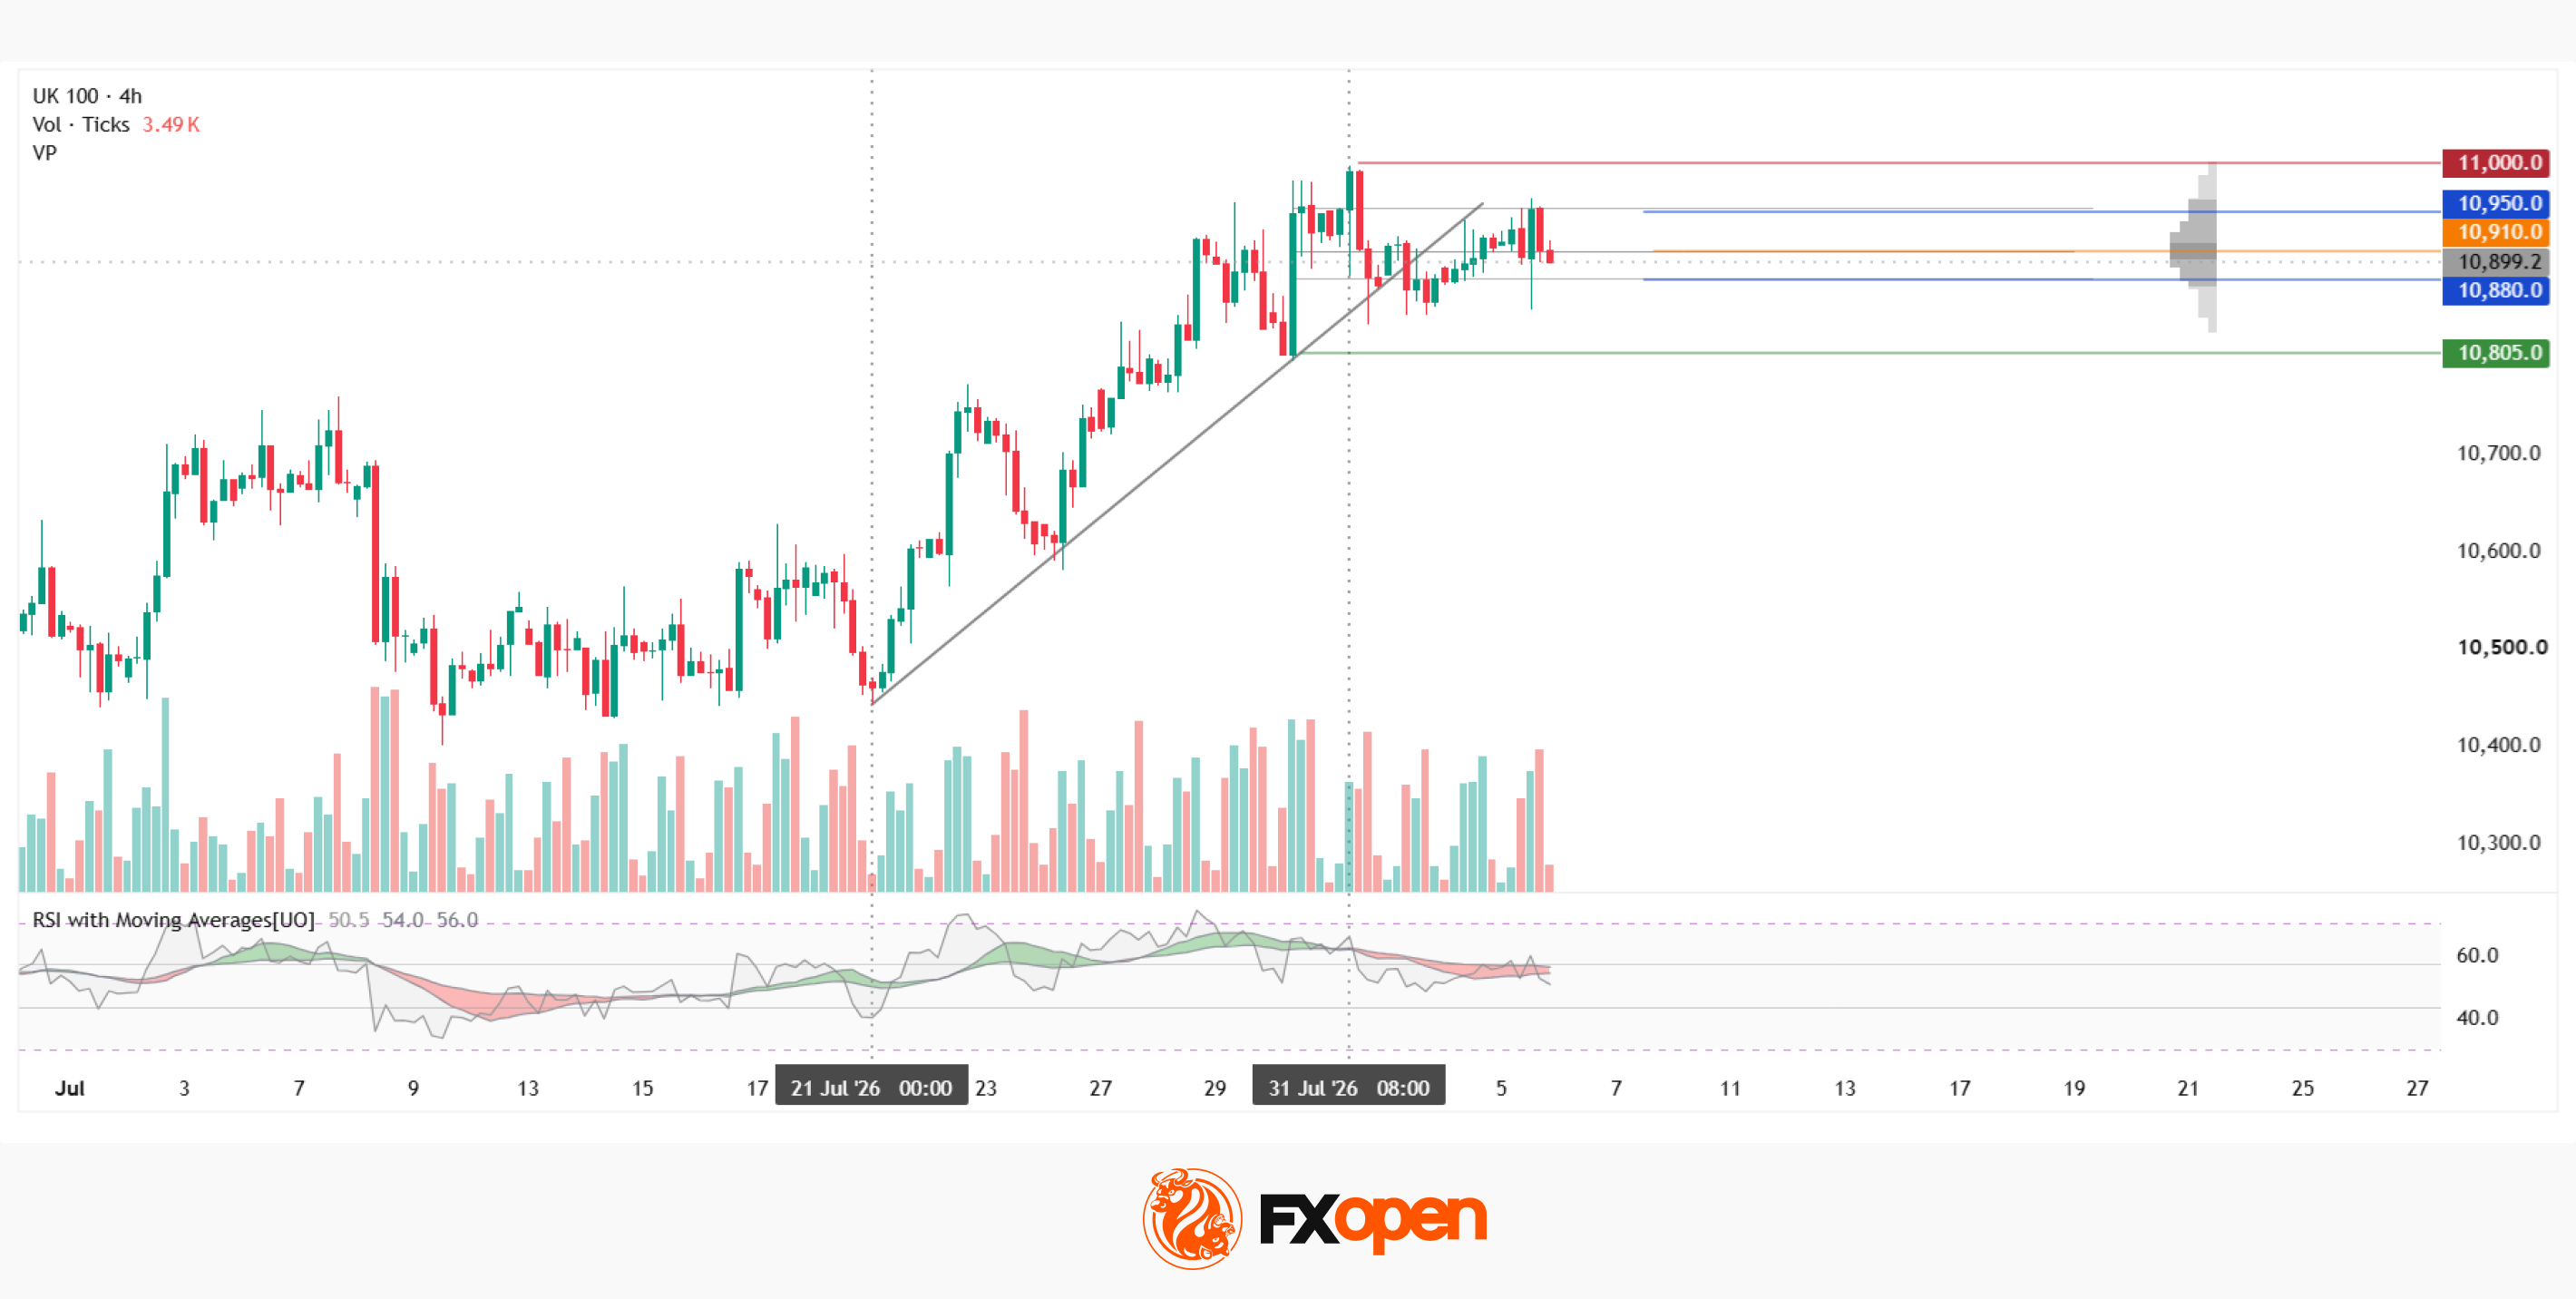
From the 21 July low near 10,450, the FTSE 100 index (UK100 on FXOpen) developed a steady upward trend along a trendline that guided the price towards the red resistance level around 11,000. The price then moved above the trendline and is currently consolidating between the boundaries of the current volume profile: the upper boundary is located at 10,950, while the lower boundary stands near 10,880, with the Point of Control (POC) at 10,910 in between. All three levels are positioned relatively close together, creating a concentrated area where the price may lack sufficient room for an extended consolidation phase within this profile.
The current market profile is surrounded by support and resistance levels on both sides: the red 11,000 level is positioned above and represents the peak of the short-term trend, while the green 11,805 level could limit further movement if the lower boundary of the profile is broken. The RSI + MAs indicator shows readings of 50, 54 and 56 — all lines remain within the neutral zone and currently provide no clear directional preference.
Summary
Strong BAE Systems earnings provide additional fundamental support for the rally, but the technical picture is already showing signs of a pause — RSI + MAs have lost momentum, and the price has remained below the recent high. The next move will likely depend on whether upcoming earnings reports from companies within the index confirm the elevated market expectations.

Trade global index CFDs with zero commission and tight spreads (additional fees may apply). Open your FXOpen account now or learn more about trading index CFDs with FXOpen.
This article represents the opinion of the Companies operating under the FXOpen brand only. It is not to be construed as an offer, solicitation, or recommendation with respect to products and services provided by the Companies operating under the FXOpen brand, nor is it to be considered financial advice.



Be the first to comment