



Ethereum is trading above its 100-day simple moving average after spending roughly two weeks below it, putting today’s daily close in focus.
Key Takeaways
- The 100-day SMA is the immediate test.
- $1,985 remains the next major resistance.
- ETF flows improved after recent weakness.
- Short-term trading demand remains uneven.
ETH is trading around $1,920 at the time of writing on August 8, slightly above the 100-day SMA near $1,906. U.S. spot Ethereum ETFs brought in roughly $245 million over the past week, while CoinGlass data show a less consistent signal from short-term spot and futures activity.
Ethereum Is Testing a Two-Week Resistance Break
The 100-day SMA has repeatedly capped Ethereum since late July, making today’s close important for determining whether the latest move can hold.
The resistance developed after ETH approached the 0.5 Fibonacci retracement near $1,985 on July 27 and was rejected. Price subsequently slipped back below the moving average and remained largely underneath it until this week’s recovery.
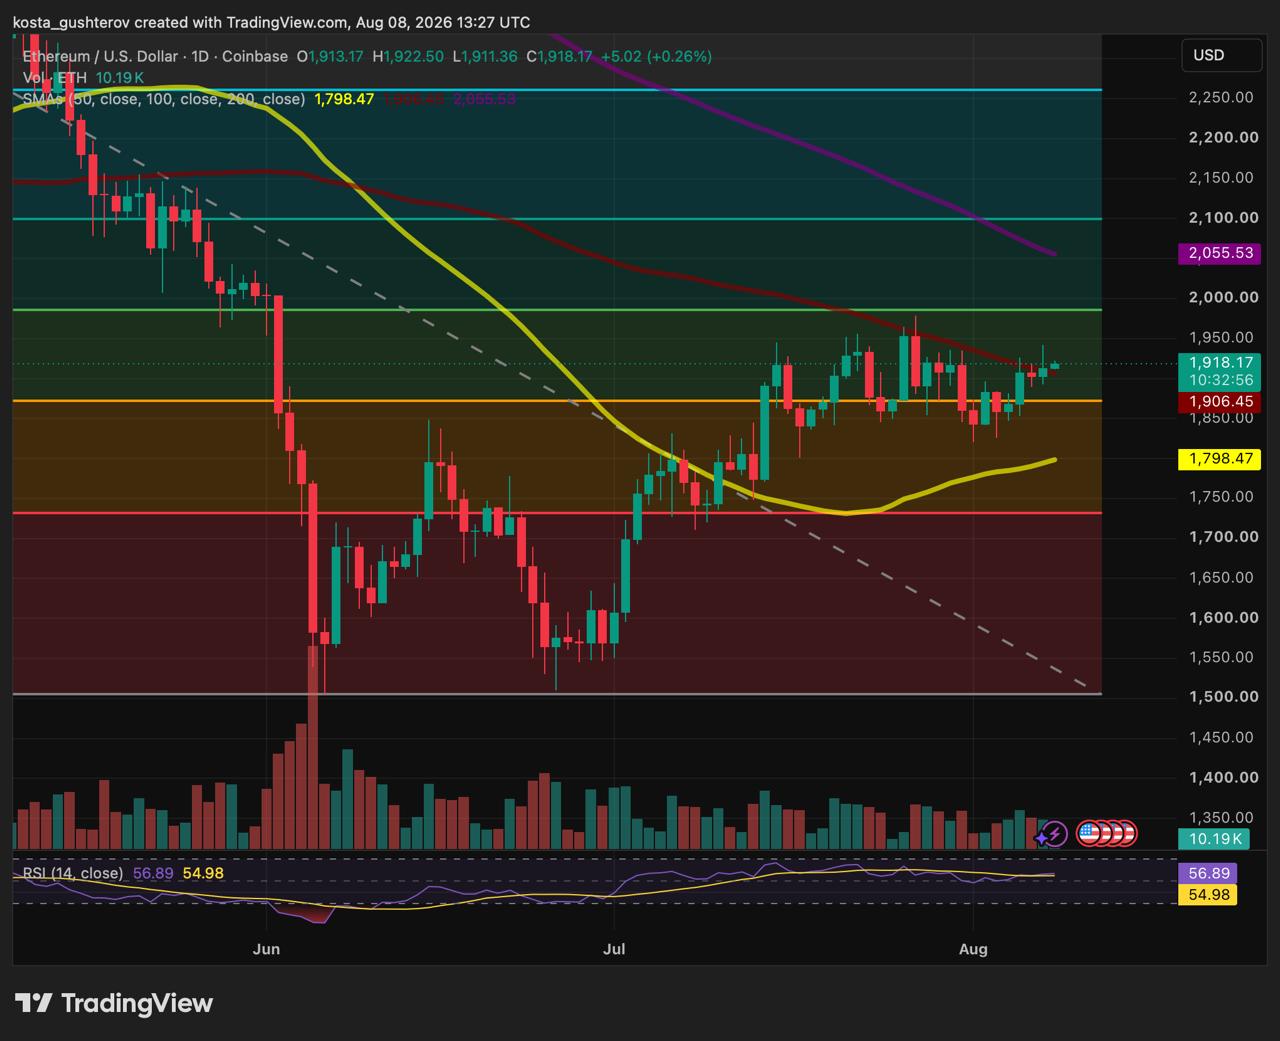
Yesterday’s move finally pushed ETH above the average, and price remains above it at the time of writing.
At around $1,905, the moving average sits close enough to current price that an intraday move below it would not be unusual. The daily close carries more information because it will show whether buyers can maintain the break after several failed attempts to recover the level.
Momentum has improved alongside the move. Daily RSI is around 57, above the neutral 50 level without reaching traditionally overbought territory.
The $1,985 Area Has Already Rejected ETH Once
Holding the 100-day SMA would still leave Ethereum facing a more difficult resistance zone.
The 0.5 Fibonacci retracement sits near $1,985, almost exactly where the July 27 advance stalled.
The area also overlaps with the broader price region from which Ethereum’s early-June decline accelerated before ETH eventually traded toward $1,500. Buyers are therefore approaching a part of the chart that has mattered during both the recent recovery and the previous selloff.
A decisive move above $1,985 would bring the falling 200-day SMA near $2,050 into view.
Until then, Ethereum has improved its short-term structure but has not yet cleared the larger resistance left by the previous decline.
ETF Flows Are Recovering From a Weak Stretch
U.S. spot Ethereum ETFs recorded roughly $245 million in net inflows over the past week, according to SoSoValue data.
The pickup is notable after a much weaker period for the funds, but one stronger week is not enough to establish a durable return of institutional demand.
Ethereum ETFs entered the latest rebound after a difficult summer stretch in which outflows repeatedly weighed on the broader flow picture. The current $245 million therefore looks more significant as an improvement from recent weakness than as confirmation of a new long-term trend.
It also coincides with ETH’s attempt to recover an important technical level. That does not mean ETF buying caused the move above the 100-day SMA, since Ethereum trades across global spot, derivatives and other markets.
For the current setup, continued inflows would matter more than the size of a single positive week, particularly if ETH reaches the $1,985 resistance again.
Trading Flows Are Not Confirming the Move Yet
CoinGlass data provide a more cautious signal than the price chart.
Spot net flow stands at roughly -$24.36 million over the past 24 hours and -$79.91 million over three days, meaning aggressive selling has outweighed aggressive buying across both windows.
Futures are less clear. Three-day net flow remains positive at about $407 million, while the latest 24-hour reading is negative by roughly $135 million.
The combination does not show sustained buying pressure across both markets as ETH attempts to hold above the 100-day SMA. Spot activity remains tilted toward aggressive selling, while futures positioning has been less consistent.
CoinGlass net flow measures aggressive taker buying against aggressive taker selling. Positive futures flow also does not necessarily represent traders opening new longs, since short covering can generate aggressive buying as well.
Futures Flows
| Time | Inflow | Outflow | Net Inflow | Net Chg % | Net Inflow/MCap |
|---|---|---|---|---|---|
| 4 hour | $242.51M | $277.74M | -$35.23M | -144.44% | -0.015% |
| 8 hour | $422.78M | $374.03M | +$48.75M | +139.43% | 0.021% |
| 12 hour | $765.29M | $705.45M | +$59.84M | +130.76% | 0.026% |
| 24 hour | $3.66B | $3.80B | -$134.72M | -124.54% | -0.058% |
| 3 day | $14.04B | $13.64B | +$407.47M | -25.41% | 0.18% |
Spot Flows
| Time | Inflow | Outflow | Net Inflow | Net Chg % | Net Inflow/MCap |
|---|---|---|---|---|---|
| 8 hour | $26.01M | $26.65M | -$649.21K | -189.00% | -0.00028% |
| 12 hour | $49.32M | $51.55M | -$2.24M | +89.89% | -0.00097% |
| 24 hour | $219.05M | $243.41M | -$24.36M | -34.67% | -0.011% |
| 3 day | $808.70M | $888.62M | -$79.91M | -830.63% | -0.035% |
Price Has Moved First, Flows Have Not Fully Followed
Ethereum’s technical position has improved faster than the supporting flow picture.
ETH is above the 100-day SMA for now, RSI has recovered above neutral and ETF flows have picked up after a weak stretch. CoinGlass data are less convincing, with negative spot flow over both the 24-hour and three-day periods and no equally clear signal from futures.
That does not invalidate the price move. It shows that stronger buying has yet to appear consistently across the markets examined here.
Today’s daily close provides the first confirmation point.
A close above the 100-day SMA would leave ETH in a stronger position to challenge the $1,985 resistance again. Closing back below it would leave the two-week resistance problem unresolved and put the nearby 0.382 Fibonacci area around $1,865-$1,870 back into focus.
- Disclaimer: This article is provided for informational and educational purposes only and does not constitute financial or investment advice. Cryptocurrency markets are highly volatile, and technical levels can fail without warning.

Kosta has reported on cryptocurrency markets and blockchain infrastructure since 2020, bringing over six years of hands-on experience in the crypto industry built through daily tracking of markets, trends, and emerging blockchain developments. Specializing in Bitcoin on-chain analysis, institutional ETF flows, and digital asset price action, his work at Coindoo has been cited by other news agencies and consistently covers market developments with a focus on data-driven reporting across Bitcoin, Ethereum, Solana, and XRP.
Over the years, Kosta has contributed to multiple crypto media outlets in different regions, authoring over 6,000 articles across the sector. His reporting spans cryptocurrency markets and the broader fintech industry, tracking not only price action but also the technological and regulatory forces shaping the ecosystem.
To support his analysis, Kosta actively leverages on-chain data and metrics from leading platforms such as Santiment, Glassnode, and CryptoQuant, enabling deeper, evidence-based market insights. He believes in the power of transparency and the data that underpins the blockchain ecosystem.
His academic background in Marketing Management from Denmark further complements his analytical approach, adding a strong understanding of communication strategy and content positioning to his work.


Be the first to comment