


What to know:
- CHZ drops 5% after a head-and-shoulders neckline break, approaching key support at $3.20.
- A minor bounce toward $3.7 is possible if lower-timeframe reversal patterns appear and BTC shows a relief rally.
- RSI rebounds above 39.79, and MACD shows a bullish crossover, signaling fading selling pressure.


Chiliz (CHZ) is under pressure after the daily chart’s head-and-shoulders neckline broke, sending the token down roughly 5% since our last update.
According to the crypto analyst Umair Crypto, it now approaches $3.20, a key support area where a minor bounce toward $3.70, about a 15% move, is possible. Traders are watching closely but not chasing the rebound.

Source: Umair Crypto’s X Post
The potential bounce becomes interesting only if lower-timeframe reversal patterns appear and the BTC pair shows a relief rally. Without Bitcoin confirmation, a trade remains speculative.
The real trigger sits at 49 points on the BTC pair; a close below would break the USDT trendline, confirming deeper downside. Until then, both charts continue along the expected path, suggesting patience.
Also Read: Chiliz (CHZ) Falling Wedge Signals Potential Bullish Breakout to $0.850
CHZ Technical Outlook Points to Sideways Movement
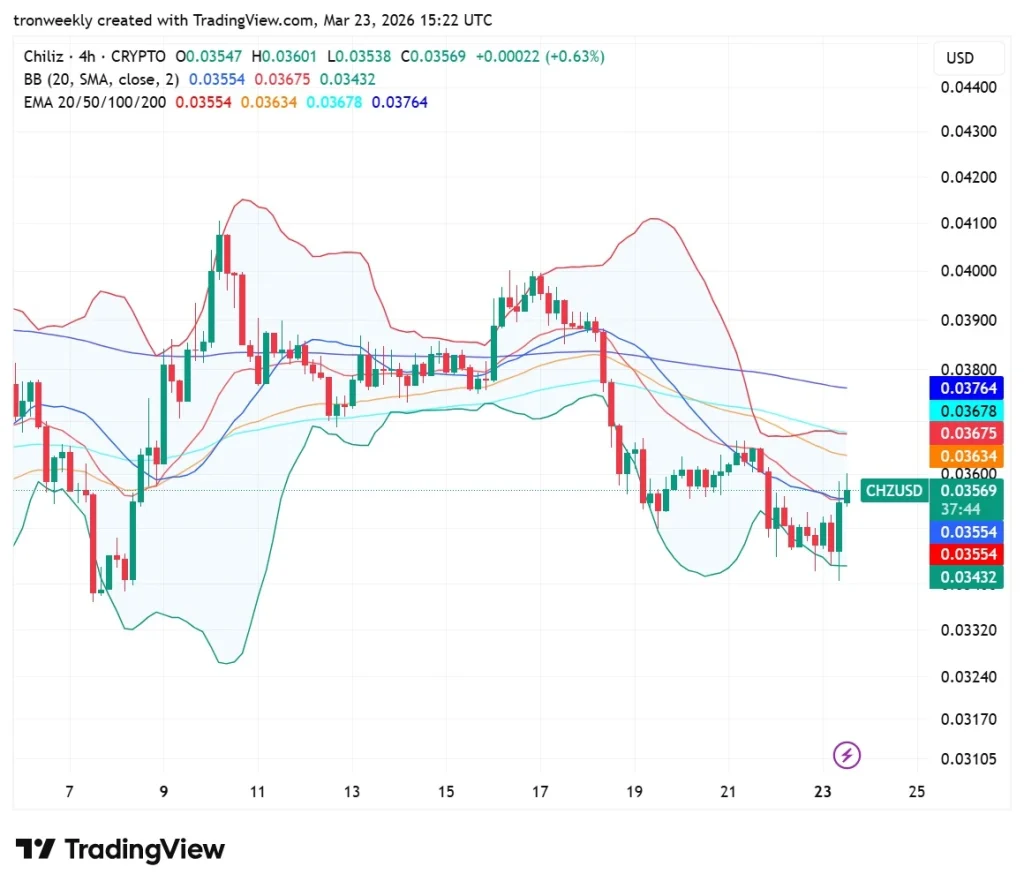
As noted on TradingView, CHZ has shown a bearish move as a result of breaking away from the resistance zone at $0.0410. The asset has shown a plunge below the 200-period EMA, which indicates that CHZ has lost its momentum.
CHZ is currently fluctuating at the $0.0356 mark, trying to find support after a plunge was felt throughout the mid-March sessions.
Source: TradingView
Volatility is decreasing as the Bollinger Bands converge, which might indicate a period of consolidation or a coming breakout. The price remains capped by the resistance of the 20, 50, and 100-period EMAs.
The trend will remain defensive until Chiliz breaks back above the $0.0370 handle, with primary support remaining solid at the $0.0343 price swing low.
Momentum Indicators Show Decreasing Pressure
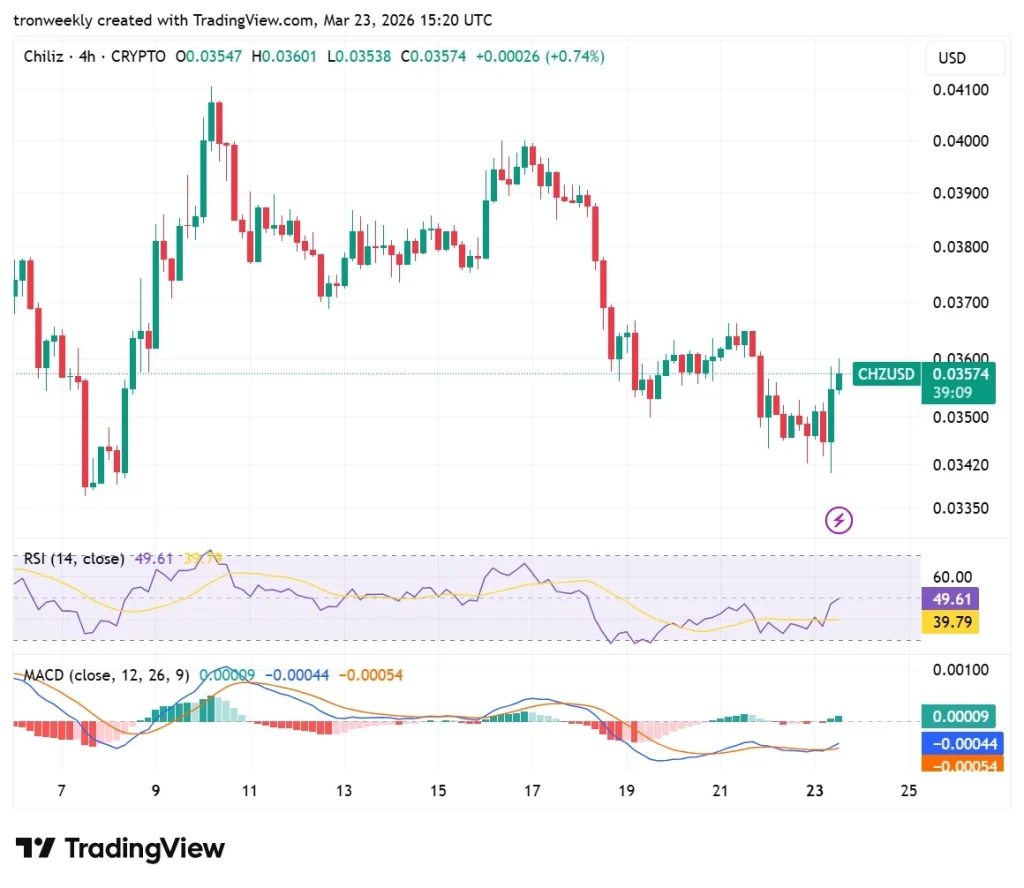
Currently, the RSI (14) is at 49.61, which is on the upswing after dipping to the oversold region. The upswing in the RSI is a sign of a change in the token’s momentum, with the RSI now moving above the yellow signal line, which is at 39.79.
The RSI is hovering around the 50-neutral region, but the upswing is a sign that the intense selling pressure is finally easing off.

Source: TradingView
The MACD indicator is showing a bullish crossover as the blue line crosses above the orange line. Although it is still in the negative region, the histogram is showing a crossover from red to light green, indicating diminishing falling strength.
This crossover is an indication of a possible trend reversal in the short term. However, the participants need to wait for the MACD to turn positive.
This article contains market analysis and price predictions. These are not guarantees. Crypto markets are volatile. Always DYOR. Not financial advice.
Also Read: Chiliz (CHZ) Eyes $0.25 as Falling Wedge Signals Strong Bullish Momentum

Be the first to comment