


What to know:
- Bitcoin is stuck between $70,600 resistance and $65,600 support, signaling a tight no-trade zone.
- Market awaits breakout as buyers and sellers hold strong positions within key range.
- Weakening momentum with RSI below the midpoint and MACD showing fading bullish strength.


Bitcoin is in a critical phase, with the market awaiting a decisive move in either direction. Buyers and sellers are holding their positions firmly, with the price stuck in a tight range. The next major move in the Bitcoin market is expected to be determined by a move above key resistances or below key supports.
At press time, Bitcoin (BTC) is trading at $68,649, and its trading volume in the last 24 hours has been $50.24 billion, with a market capitalization of $1.37 trillion, as per CoinMarketCap. Over the last 24 hours, the price of BTC has dipped slightly by 0.8%.

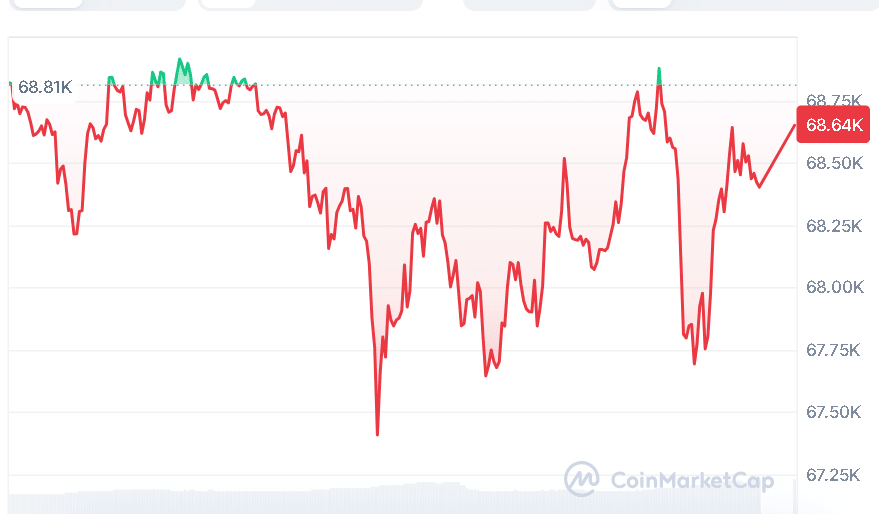

Source: CoinMarketCap
Bitcoin Awaits Breakout From Key Range
On March 23, 2026, a prominent crypto analyst, Ali Martinez, reported that Bitcoin is currently in a ‘No-Trade Zone.’ The price range of $70,685 to $65,636 is a critical price range for the market. More than 1.72 million BTC has been exchanged at these price levels, implying that both parties are holding their positions.


Source: Ali Martinez’s X Post
According to a crypto analyst, Ali Martinez, the next major price movement will occur when the price of Bitcoin goes above $70,685 or goes below $65,636. The sideways trend will continue until then.
Bitcoin Shows Signs of Slowing Momentum
The momentum in the short-term value of Bitcoin is declining. The Relative Strength Index value is 44.30, which is close to but slightly below half. This indicates moderate pressure on the growth rate.
The short-term moving averages are at $70,225 and $69,151. The current stock price is slightly lower compared to these moving averages. The long-term moving averages are at higher levels of $79,152 and $92,363.

Source: TradingView
The MACD indicator is also reflecting the fading of momentum. The MACD line is at -179.71, whereas the signal line is at -242.21. The histogram is reading 62.51 at the moment; however, it is declining.
This indicates that the uptrend is losing momentum, and Bitcoin may either trade sideways or fall slightly until buying pressure is resumed.
Also Read | Zcash Struggles to Hold Support as $300 Reclaim Becomes Critical for Bulls
Bitcoin Stuck Between Critical Price Zones
For the time being, the Bitcoin market is in a waiting phase. The investors are observing the critical support and resistance areas because they are aware that a strong break above $70,685 or a break below $65,636 may determine the next trend. The short-term trend is not strong; however, the overall market trend is still determined by these areas.
This article contains market analysis and price predictions. These are not guarantees. Crypto markets are volatile. Always DYOR. Not financial advice.
Also Read | Polkadot Holds Steady at $1.41 as Breakout Target Nears $4.50 Amid ETF Boost
Be the first to comment