



Despite a significant spike in volatility in late July, Shiba Inu is still trading within a dominant downtrend. As of right now, SHIB is trading close to $0.00000462; a convincing structural reversal has not been established despite the recent rebound. The rejection around $0.00000500 is the biggest issue.
Shiba Inu’s burst of buying support
At the end of July, SHIB momentarily burst above this region, reaching about $0.0000058, but buyers were unable to sustain the breakout.
A significant portion of the move was erased by the subsequent retracement, which brought SHIB back below its longer-term moving average at $0.00000497. The price has some short-term support below it. There is a comparatively small technical support zone around $0.00000446-$0.00000464, where the faster moving averages are concentrated.

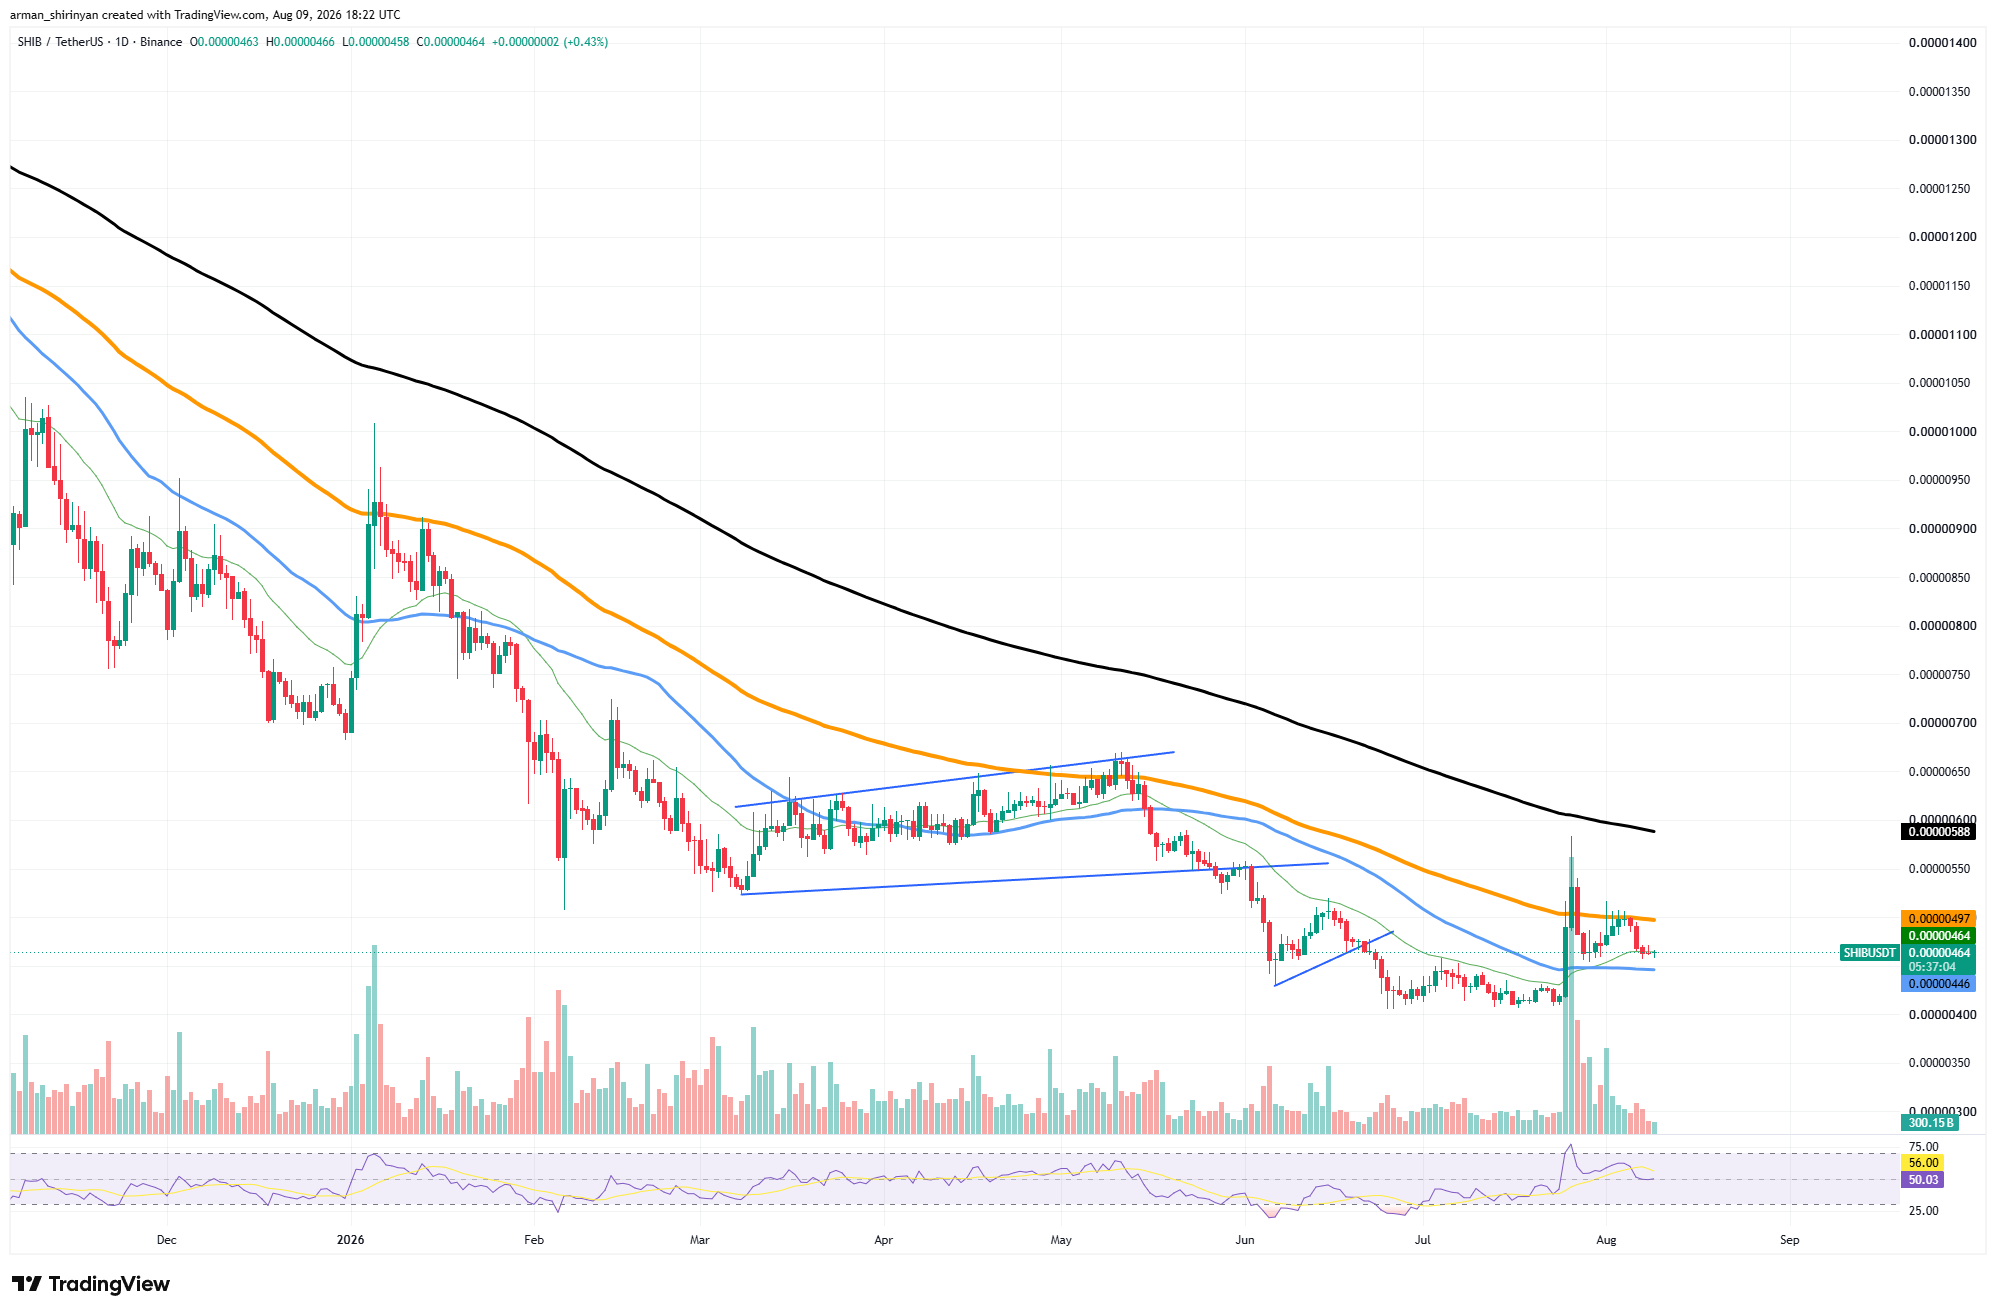
Another attempt at recovery would be feasible if it remained above $0.00000445. On the other hand, a breakdown would reveal the July consolidation around $0. 00000410-$0. 00000420. The momentum is not very weak. After cooling from the late-July spike, the daily RSI is now close to 56. As a result, SHIB is in neutral to positive territory and is not getting close to being overbought.
Participation is the issue: volume increased significantly during the first breakout but has since decreased. $0.00000500 must become support rather than resistance if SHIB is to significantly strengthen its structure. Reopening $0. 0000055 and eventually the 200-day moving average close to $0. 00000588 could result from a sustained move through that level.
Until then, SHIB is still torn between a much weaker long-term trend and improving short-term momentum. Buyers are still able to make aggressive moves, but they haven’t yet proven they can hold them, as the late July rally demonstrated.
Solana’s stabilization attempts
After months of intense selling pressure, Solana is making an effort to stabilize, but buyers still face a substantial technical obstacle on the daily chart. SOL is currently trading at $76. 46 after rising from the low of $62-$63 in June.
$78 to $79 is the current battleground. Since July, SOL has frequently struggled in the vicinity of $78. 54, which is the location of the longer intermediate moving average. The asset would finally start to break away from the cluster of shorter-term averages if there was a daily breakout above it.
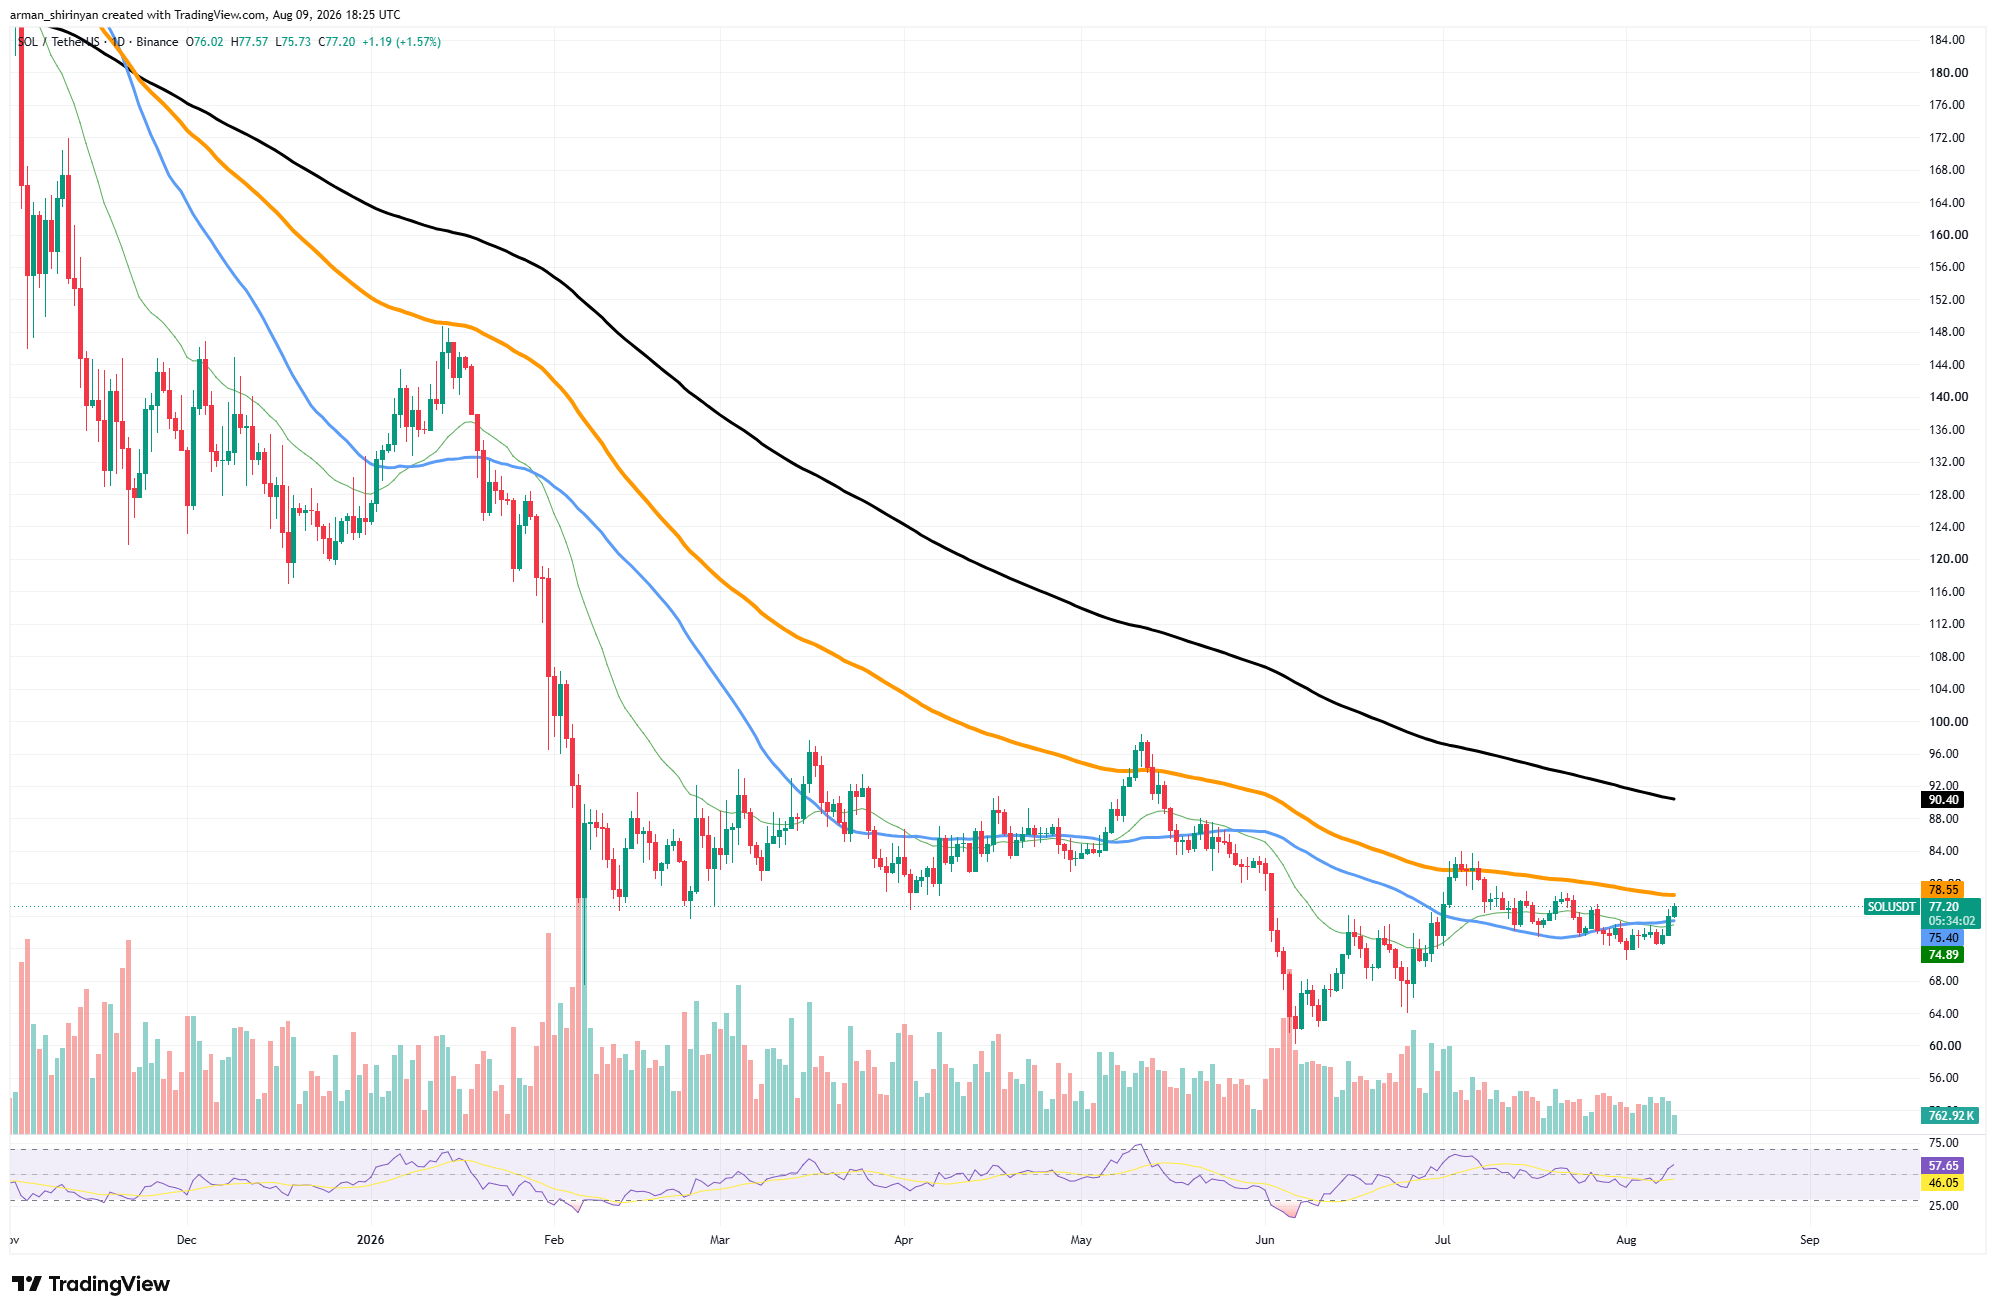
The faster averages of $74.83 and $75.38 are already exceeded by SOL. This provides the present recovery with a technical basis.
While its signal line is still at about 45.9, RSI has also increased to about 55. 6. As a result, momentum slightly favors buyers, but there is no extreme reading indicating that a significant breakout has already begun.
There are still issues with the broader trend. SOL’s 200-day moving average, which is significantly above the market price, is still falling close to $90. 40. Therefore, rather than confirming a new significant uptrend, even a breakout above $79 would initially indicate an improvement in the medium-term structure.
The next significant region is between $84 and $86, where SOL spent a significant amount of time consolidating earlier this year, if buyers clear $79. $90-$91 becomes the main test after that. The current setup would be weakened if the $74-$75 moving-average cluster were to disappear, which could push SOL closer to $70.
Hyperliquid gains more traction
Following its correction from the June-July highs, hyperliquid is getting close to a critical point. At $54.54, HYPE is currently trading between multiple layers of resistance and significant long-term support.
There has been a significant adjustment. In early August, HYPE lost its bullish sequence and fell toward $52 after repeatedly hitting the $72-$76 range. Two moving averages are currently concentrated around $56-$57, where the most recent bounce has faltered. The first significant barrier for buyers is these levels, which are close to $56.73 and $57.30.
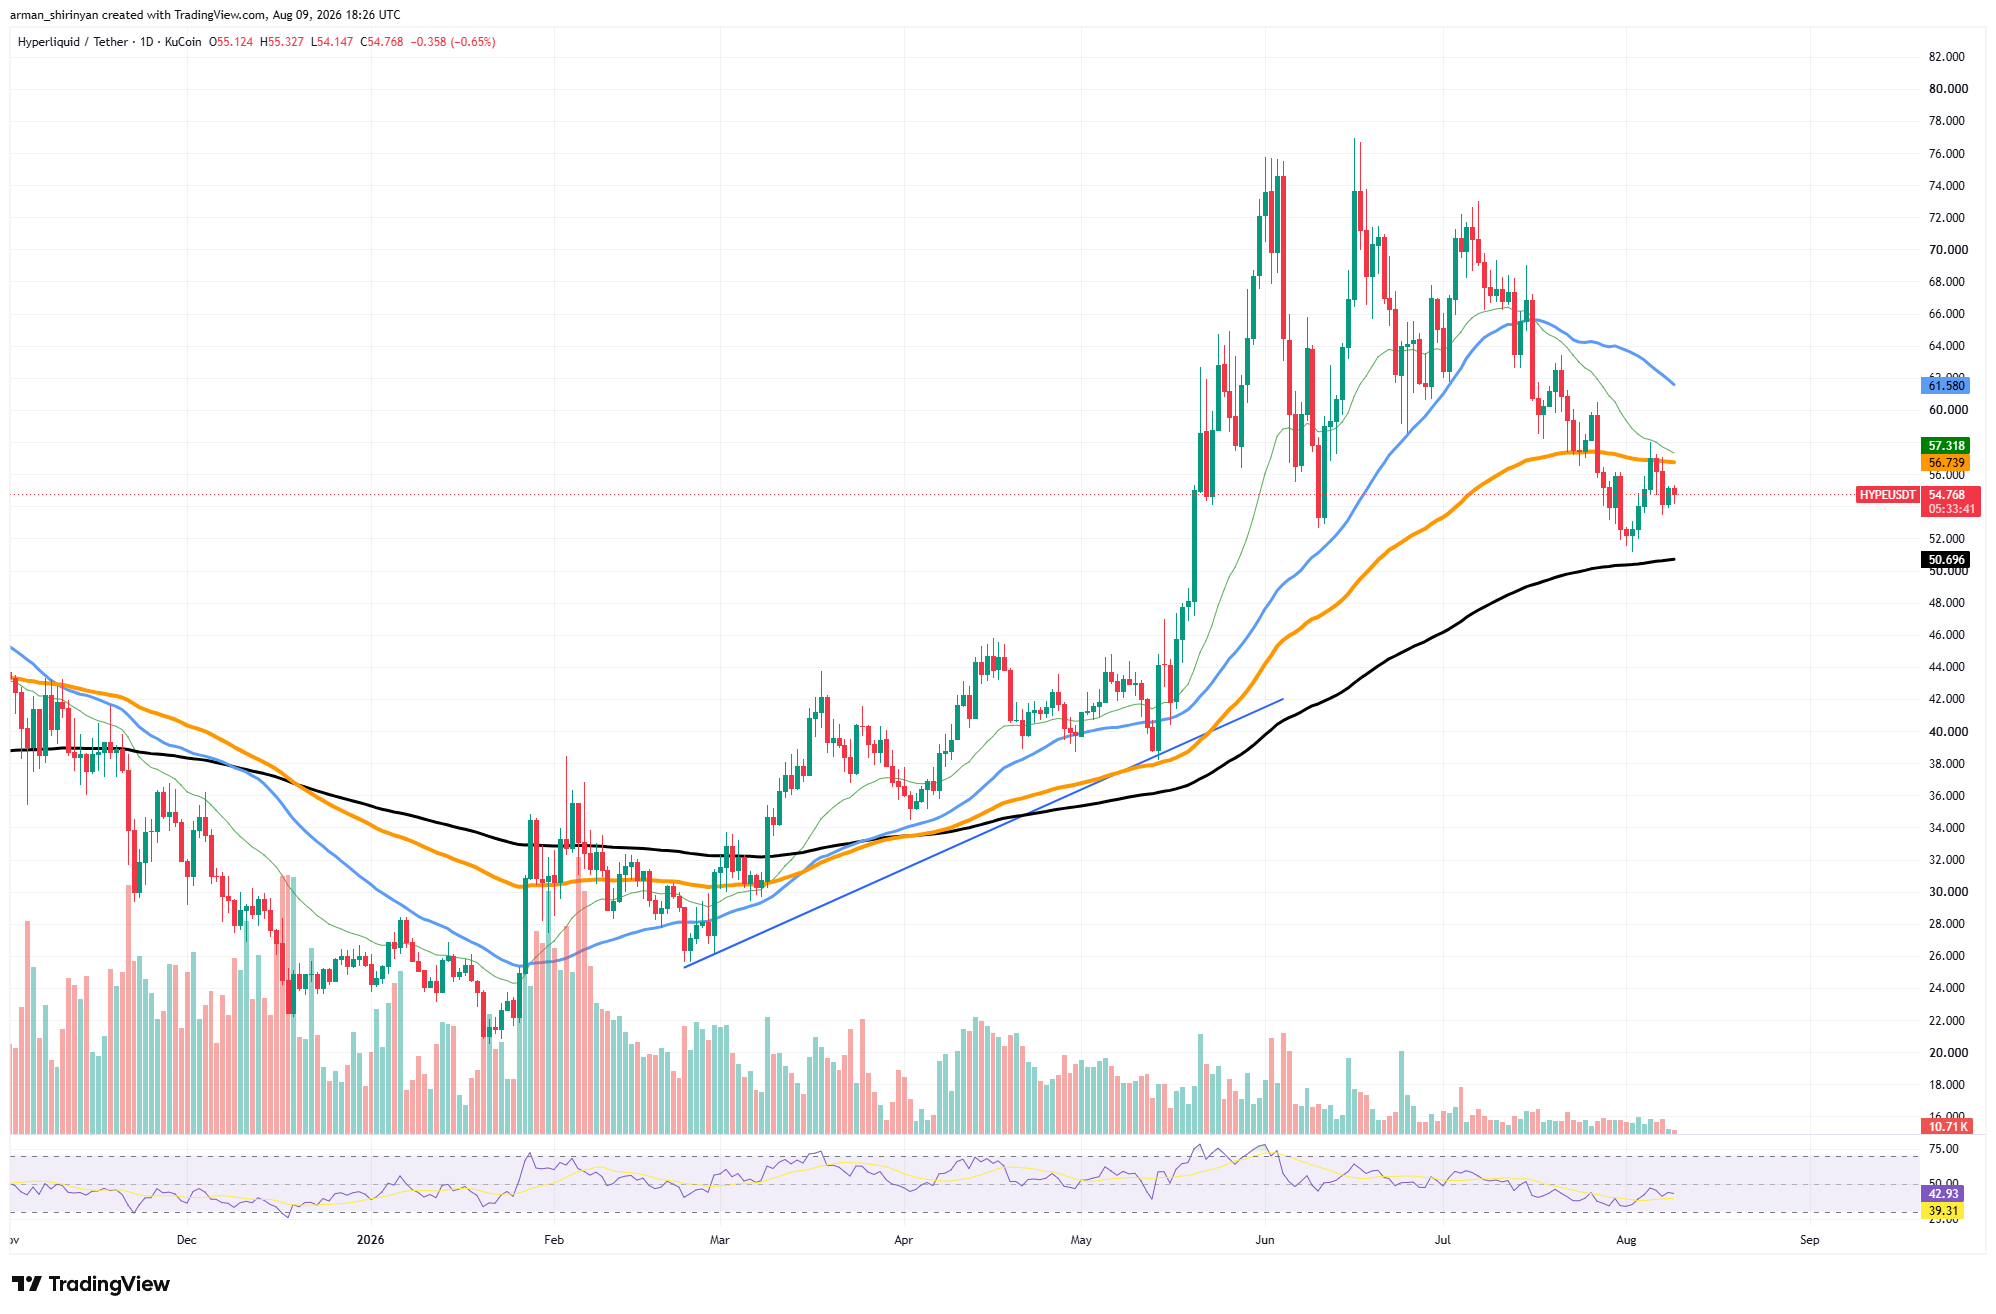
More significantly, HYPE is still below the blue moving average at $61.58. Therefore, recovering $57 would enhance the setup right away, but a move above $61-$62 would offer much more convincing proof that the correction is coming to an end.
The 200-day moving average at $50.69 is currently a key component of the bullish argument. It hasn’t been broken and is still rising. As a result, the overall structure is much healthier than what the short-term price action indicates. HYPE can still view the current drop as a significant correction within its larger recovery as long as $50-$51 endures.
RSI is below the neutral 50 threshold at about 42. 5. In comparison to the explosive activity that accompanied the May-June rally, trading volume has also drastically decreased. The technical picture would rapidly worsen if HYPE lost $50, possibly exposing $46-$48.
On the other hand, recovering $57 and then $61. 50 would allow bulls to aim for $65–$67. Although HYPE is still technically vulnerable for the time being, the chart cannot become clearly bearish due to the rising 200-day support.
Binance Coin’s unexpected rise
With BNB rising to about $603.92 and trying to break through a significant moving-average barrier, Binance Coin is generating one of its more profitable short-term setups in recent months. Particularly significant is the $602-$604 range. After spending the majority of June and July below its orange moving average, BNB has now reached it at roughly $602.20.
A verified daily close above this range might indicate a significant change in medium-term momentum. Around $584.41 and $575.11, BNB is trading comfortably above moving averages. Since the July low, price action has printed a series of higher lows.
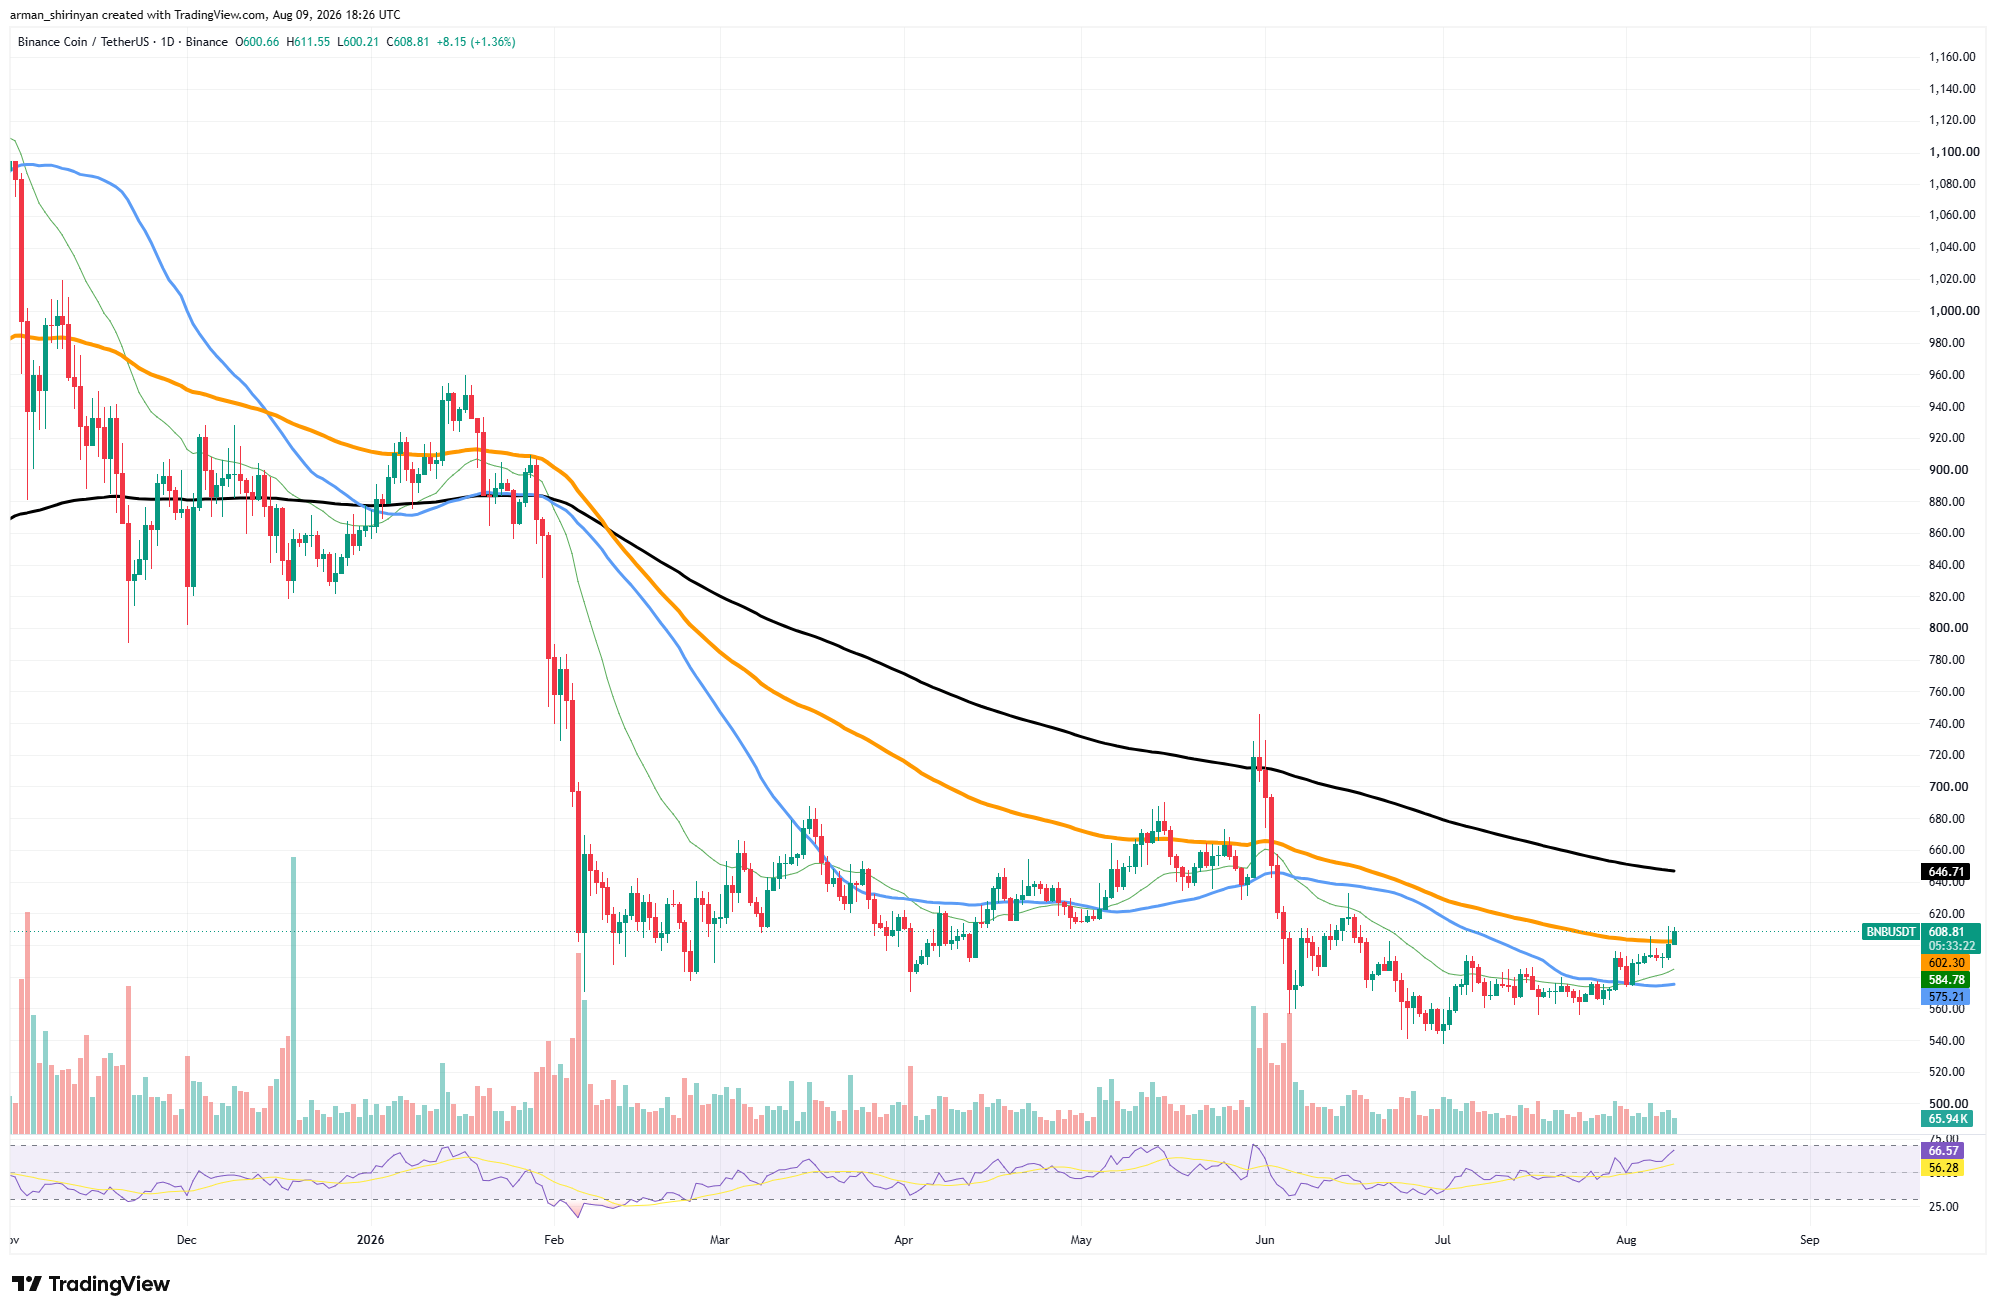
The current move has progressed gradually rather than through a single unsustainable spike, in contrast to a number of earlier attempts at recovery. Momentum supports that progress.
The daily RSI has risen to roughly 64.4 and is still above its signal line at 56.1. BNB is now firmly in bullish territory, but it hasn’t yet crossed the traditional overbought threshold, which is around 70.
The general downward trend hasn’t gone away, though. The 200-day moving average is still sloping downward and is significantly higher at about $646. 66. That level is the most noticeable technical barrier.
Buyers would still need to get past about $620 and then $645-$650 before the larger structure could become convincingly bullish, even if BNB established itself above $602. The first significant support on the downside is $584.
A move below $575 would seriously threaten the current recovery structure, while losing it would weaken the breakout attempt. As a result, BNB is gaining momentum and making a legitimate breakout attempt; however, $602 needs to be confirmed. Above it, the much more significant $645-$650 resistance zone is open to market challenge.



Be the first to comment