


What to know:
- Bitcoin whale inflows hit an 11-year high, signaling unprecedented large-scale capital movement.
- Historical 52-week cycles show repeated patterns of expansion followed by consolidation or decline.
- Current price sits near a critical long-term trendline, marking a potential accumulation or risk of breakdown.


Bitcoin’s market is currently witnessing an extraordinary event. Data from CryptoQuant reveals that BTC’s whale inflows have surged to levels not seen in the past 11 years.
This metric tracks how quickly large holders are moving capital into exchanges. The current spike surpasses previous highs, even those observed during major market tops and bottoms in past cycles.


Source: X
Experts explain that this inflow momentum is quite strong, indicating that there are large position changes. Large players are entering the market with a lot of buying activity.
They are shifting a lot of money quite quickly. This unusual inflow indicates a large volume movement and hedge activity.
Also Read: Bitcoin Price Drops Under $90K Following 16,300 BTC in ETF Outflows
Bitcoin Long-Term Cycles Show Repeating Patterns
Some traders believe in the four-year cycle theory of Bitcoin. However, The House Of Crypto’s recent analysis reveals some problems with this theory.
According to their research, the bottom prices of Bitcoin in the mid-term years do not align with large economic trends. A longer-term look at 52-week cycles (roughly one year) follows a more consistent pattern.
If we look at charts over several years, the pattern is obvious: rapid, large moves up, followed by long periods of sideways trade or a move down.
In this first chart, the rapid move up in Bitcoin is followed by a return of most of the gains, with the asset finally finding support near a long-term rising trendline.
The trendline has been a backbone where long-term buyers have stepped in to support the asset in each of the downtrends. The same is true in the second and third charts, which show the 52-week cycles in the asset.
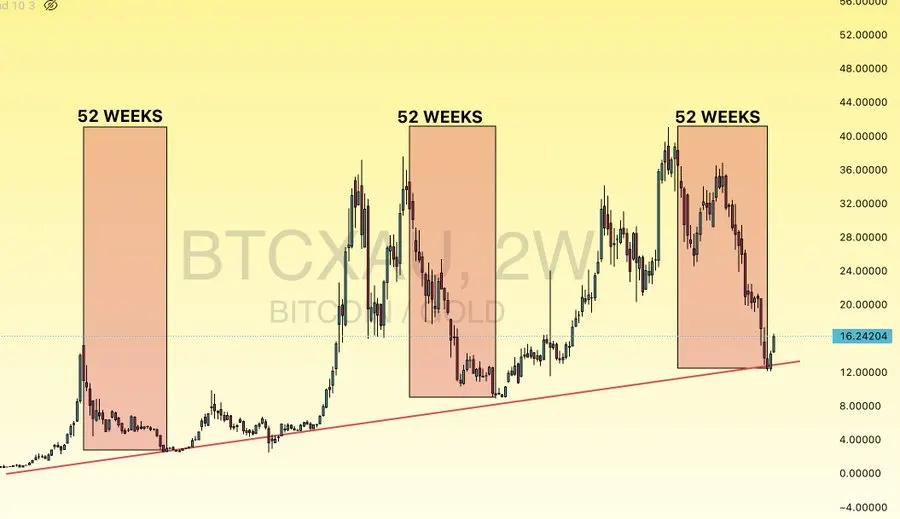

Source: X
Each rapid move up in the charts has been followed by a peak, and then a long-term move down to once again find support near this rising trendline. The most recent chart shows less bullish momentum before the big move down.
Critical Inflection Point Ahead
Bitcoin is close to an important trendline and is resting on long-term support. This has been a buying opportunity to accumulate to start a new up cycle.
However, some analysts are cautioning that if this support is pushed too hard, as some big players are pulling back, or if the market turns down, then the price could start to break down. From a big-picture point of view, there are some bullish signs.
This time last year, or two years ago, liquidity was low, the Fed was shrinking its balance sheet, and the ISM manufacturing index was not as strong as it is now. All these are bullish signs for crypto.
This article contains market analysis and price predictions. These are not guarantees. Crypto markets are volatile. Always DYOR. Not financial advice.
Also Read: Bitcoin Price Stabilizes Near $70.7,00 and Support Zone Holds, $65,000 Possible

Be the first to comment