



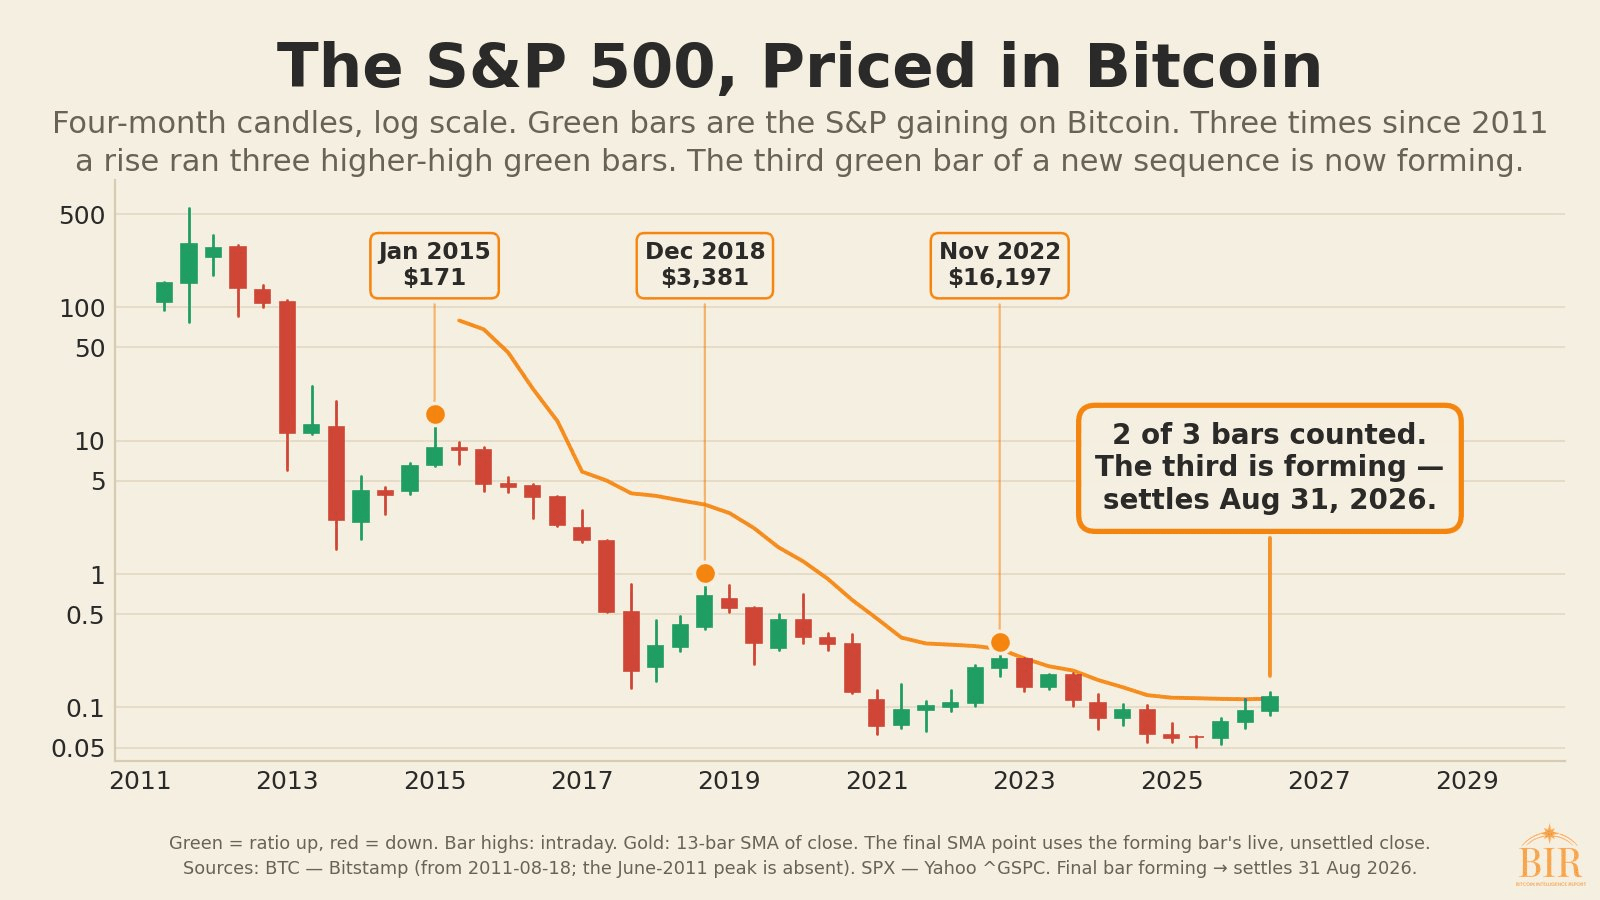
- The S&P 500/BTC pattern previously appeared near Bitcoin’s 2015, 2018, and 2022 lows.
- The third four-month bar closes August 31 after already exceeding the prior bar’s high.
- Glassnode and Galaxy still say Bitcoin bottom signals remain incomplete despite the setup.
A rarely triggered Bitcoin-versus-equities pattern has returned, renewing attention on a ratio that previously appeared near three major cryptocurrency cycle bottoms.
Market analyst Oliver L. Velez highlighted the setup by dividing the S&P 500 level by Bitcoin’s dollar price, reversing the usual comparison. A rising ratio shows equities gaining relative strength, while a falling reading means the cryptocurrency is outperforming U.S. stocks.
With the S&P 500 at 7,757.64 and Bitcoin near $65,004, the ratio stands near 0.119. However, the figure measures relative performance rather than a tradable market price.
Velez’s report shows the ratio falling from roughly 500 in 2011 to around 0.1 today. More importantly, one specific four-month pattern has appeared only three times.

Rare Three-Bar Pattern Matched Previous Cycle Lows
In each historical case, the chart printed three consecutive green four-month bars, with every bar producing a higher high than the previous period. The third bars peaked on Jan. 14, 2015; Dec. 7, 2018; and Nov. 22, 2022.
BTC traded near $171, $3,381, and $16,197, respectively. Velez said the 2015 and 2022 readings aligned with cycle lows on the same day. Meanwhile, the 2018 signal appeared eight days early. That 2018 reading still arrived within 5.9% of the eventual bottom, according to the report.
Those dates broadly correspond with major lows identified by Fidelity in January 2015, December 2018, and November 2022. However, Fidelity has cautioned that Bitcoin’s roughly four-year cycle comes from limited historical evidence and cannot provide precise market timing.
A fourth sequence is now developing. Its first bar closed in December 2025, followed by another in April 2026. The third bar closes Aug. 31, and Velez said it has already exceeded the previous bar’s high.
August 31 Becomes the Next Confirmation Checkpoint
The setup does not establish that Bitcoin has reached another bottom. Velez explicitly warned that the historical pattern offers no guaranteed outcome. However, that limitation matters considering that BTC sits in the denominator.
Consequently, the S&P 500/BTC ratio naturally rises when the cryptocurrency weakens sharply against equities. The pattern’s significance instead comes from its rarity and its historical concentration around three recognized market lows.
Other indicators also remain incomplete. Glassnode said in Aug. 5 that profitability compression had entered previous bottoming territory, although institutional demand remained weak. Galaxy Research added in Aug. 7 that Bitcoin had repeatedly tested its 200-week moving average during July.
However, it remained too early to declare a bottom. Therefore, Aug. 31 represents a statistical checkpoint rather than confirmation. Velez said another green September-to-December bar would break the historical pattern for the first time.
Related: Bitcoin Has Changed More Than You Think: What Forks Mean for BTC’s Security and “Original” Bitcoin
Disclaimer: The information presented in this article is for informational and educational purposes only. The article does not constitute financial advice or advice of any kind. Coin Edition is not responsible for any losses incurred as a result of the utilization of content, products, or services mentioned. Readers are advised to exercise caution before taking any action related to the company.



Be the first to comment