


What to know:
- Solana shows a weak recovery with a bearish wedge pattern forming.
- Momentum indicators point to slowing strength and seller dominance.
- Key support and resistance levels will decide the next major move.


Solana’s recent price structure reflects a market caught between recovery hopes and underlying weakness. Analyst CryptoBullet highlighted concerns, pointing to a rising wedge pattern on the 3-day SOL chart.
This movement occurred after a large drop, where Solana went below critical price levels and the 200-week moving average. This break changes the long-term perspective since this price level is considered to reflect the overall market trend.

The price movement up is likely due to short-term influences such as bargain hunting and short-covering, rather than genuine buying interest.
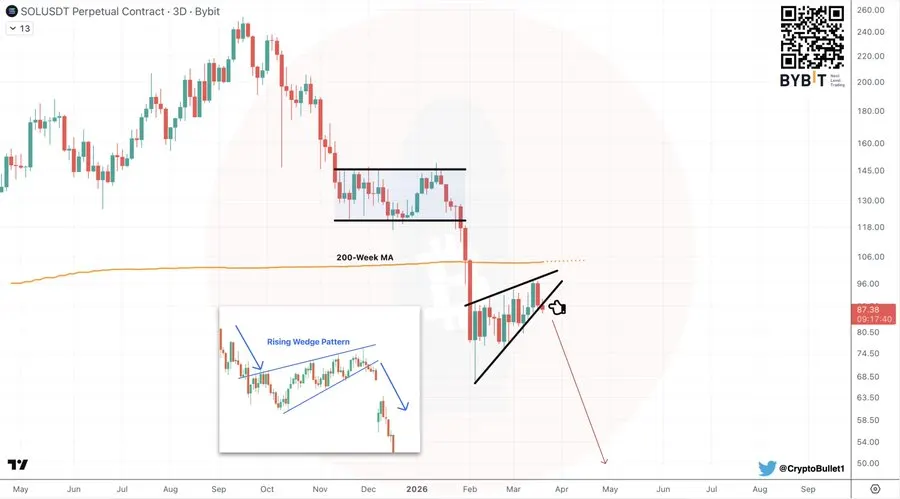

Source: X
Within the wedge formation, the price is still making higher highs and higher lows; however, these higher highs are gradually forming.
Each rise is weaker than the last, which illustrates that the buyer cannot sustain the pace. In most cases, a rising wedge that appears after a large decline will continue to fall in line with its original trend.
If Solana goes below the base of this formation, another large decline is possible. The potential target would probably align with old levels where demand was last seen.
Also Read: Solana Price Near Breakout as $91 Resistance Caps Rally
Solana Weekly Structure Shows Market Uncertainty
According to analysis from Tradingview, the weekly chart for Solana is showing that it is trading in the low $90s after its rise. It is in a neutral position after its uptrend. The long-term position for Solana is okay, but its recent signs are showing weakening momentum.
Its 100 and 200 EMA are still increasing, which is a positive sign in the long term. However, its 20 and 50 EMAs are neutralized, which is an indication that its uptrend is slowing down.
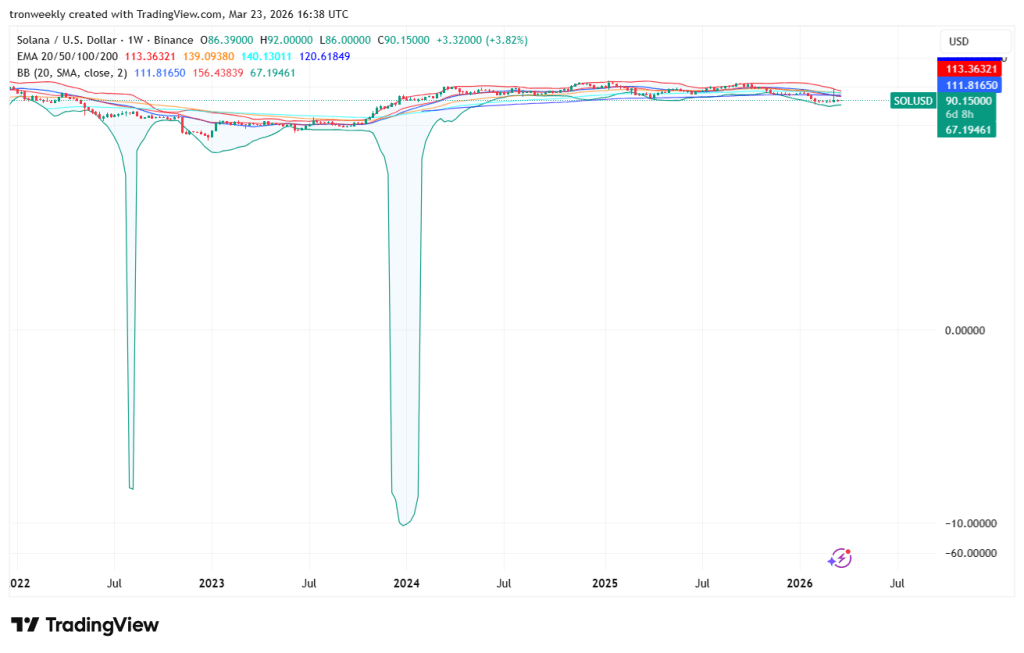
Source: Tradingview
Bollinger Bands are close together, indicating low volatility. This is usually a precursor to a large move, although we cannot determine the direction of the move.
At the same time, the price being close to the middle band suggests that buyers and sellers are balancing each other.
Indicators Point to Weak Momentum
Momentum indicators are falling. The RSI is in the mid-30s, which is low. It is not oversold but does show that sellers are in charge. The MACD is also showing a bearish reading because its line is above its MACD line, and histogram bars are falling.
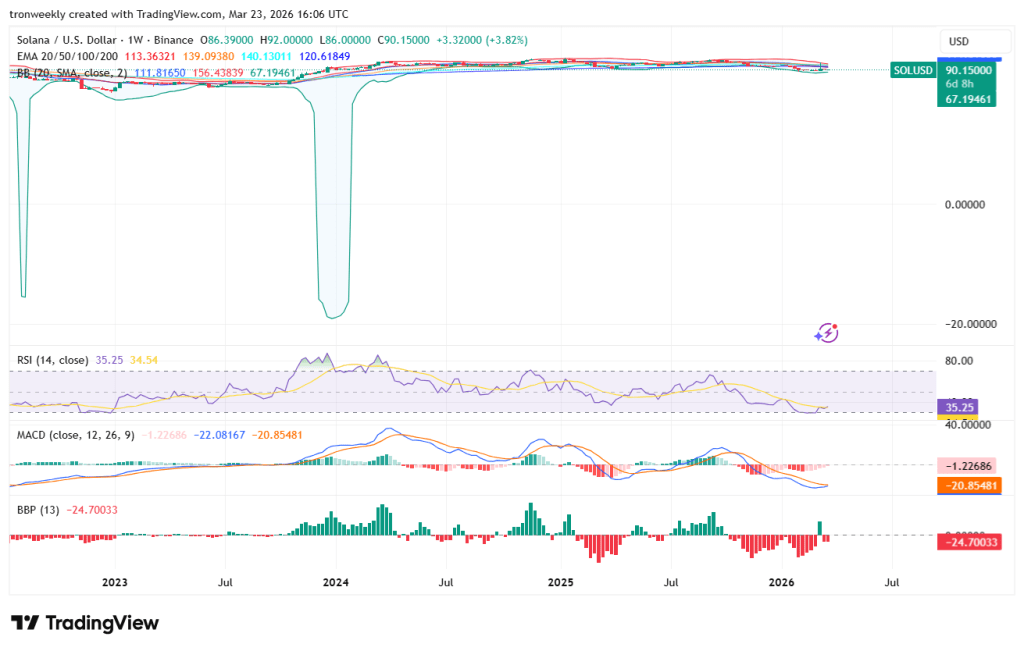
Source: Tradingview
However, they are not getting larger but are actually getting shorter, which suggests that perhaps the selling pressure is abating somewhat. The Balance of Power is negative, which suggests sellers are in charge.
This article contains market analysis and price predictions. These are not guarantees. Crypto markets are volatile. Always DYOR. Not financial advice.
Also Read: Solana Price Builds Momentum Near $90 With $100 in Sight
Be the first to comment