



What to know:
- QNT price gains 1.23% while buyers defend the key wedge support zone near $56.50–$57.
- A confirmed wedge breakout could lift QNT toward the analyst’s key $62–$63 target range.
- QNT futures volume rises 30.72% as open interest climbs 3.39% to reach $13.00 million.

The QNT price shows signs of recovery on Thursday, August 13, 2026, with the buyers holding firm at the wedge support zone. Meanwhile, futures volume and open interest are rising, pointing to stronger derivatives activity.
As of writing, Quant (QNT) is trading at $58.22, representing an increase of 1.23% in the past day. The 24-hour trading volume stands at $19.54 million, with a market capitalization of $702.94 million. Over the last seven days, the QNT price has decreased by 2.9%, according to CoinMarketCap.
Also Read: NEAR Price Eyes $2.40 as Bullish Reversal and AI Privacy Upgrade Boost Outlook

How a Wedge Breakout Could Push QNT Price Higher
Analyst Crypto With Gopal highlighted that QNT is forming a falling wedge as the token continued to compress between descending trendlines.
Meanwhile, buyers were defending the $56.50–$57 area. The analyst identified this zone as key support within the current formation. He also highlighted the wedge’s upper trendline as the main breakout level to watch.
According to the analyst, a confirmed move above the upper trendline could strengthen momentum. Such a breakout could push the QNT price toward the $62–$63 target range.
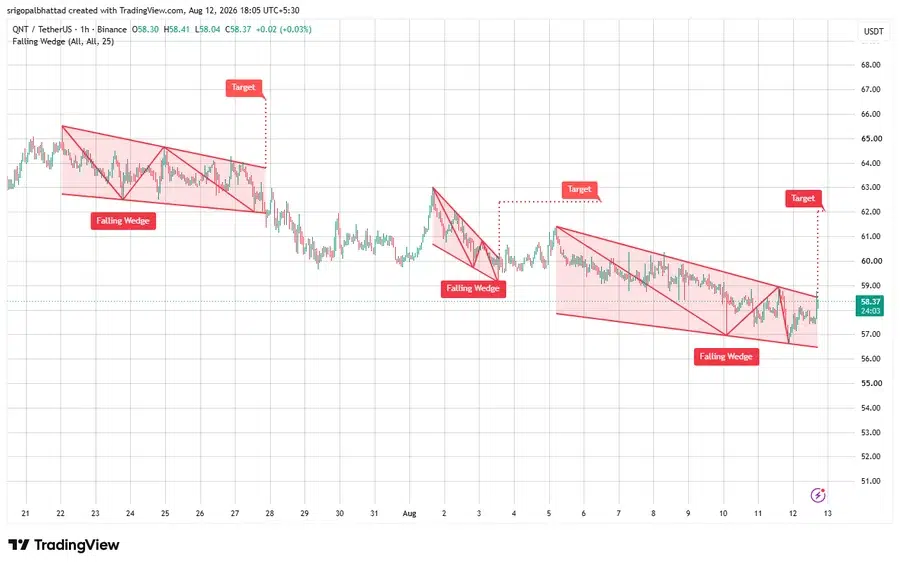
However, the pattern has not yet produced the required confirmation. The analyst therefore maintained a bullish outlook but stressed that a clear breakout is still needed.
Moreover, another analyst, MCO Global, shared a cautious QNT price outlook. The analyst mentioned that Quant had remained within a long-term range for some time.
It had spent most of the long-term range in its lower half, while sellers rejected repeated recovery attempts. MCO Global said a pullback toward $55–$56 could produce another E-wave bounce inside the triangle.
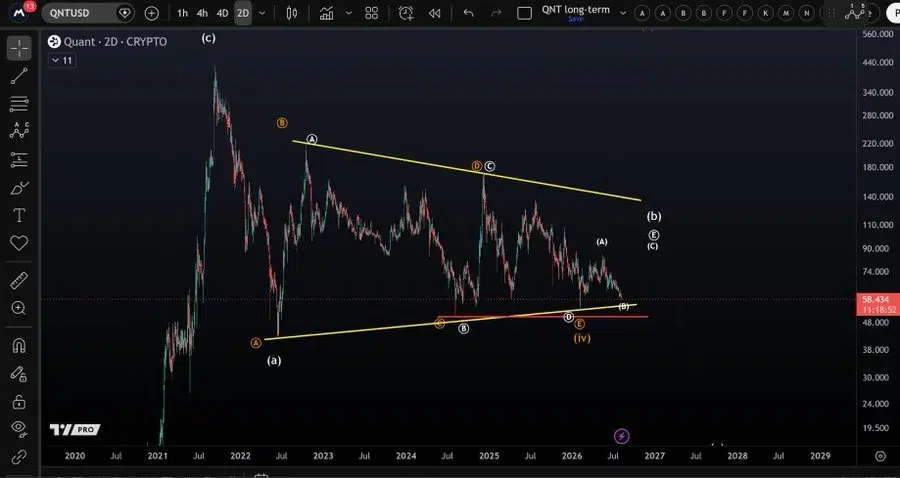
Despite this possibility, MCO Global continued to favor the white bearish scenario. The alternative orange count allows for a completed wave-four triangle, followed by a fifth wave higher.
However, the analyst said the recovery from the 2026 low is too weak to support that outlook. A move below $50 would fully invalidate the orange count.
Why Is QNT Futures Activity Rising?
CoinGlass data shows a 30.72% rise in QNT futures volume to $15.41 million. Open interest increased 3.39% to $13.00 million. The OI-weighted funding rate stood at 0.0100%.
Total liquidations reached $809.31 during the past 24 hours. Long liquidations accounted for $469.25, while short liquidations totaled $340.06. Long positions therefore accounted for the larger share of total liquidations.
What QNT’s EMAs and Bollinger Bands Signal
According to TradingView, the daily chart shows that the QNT price is below its Exponential Moving Average (EMA). The 20-day EMA stood at $60.36. The 50-day EMA is at $63.28. Both levels remained above the current value of $58.22.
The long-term averages also remained above the QNT price. The 100-day EMA stood at $66.19, while the 200-day EMA is at $70.28. This structure placed the shorter-term averages below the longer-term averages.
The Bollinger Bands (BB) showed the QNT price near the lower boundary. The middle band stood at $60.39, while the upper and lower bands were $63.70 and $57.08, respectively. QNT remained $5.48 below the upper band and $1.14 above the lower band.
Also Read: BNB Price Eyes $1,380 as Bullish Pattern and RWA Growth Fuel Rally Hopes
This article contains market analysis and price predictions. These are not guarantees. Crypto markets are volatile. Always DYOR. Not financial advice.


Be the first to comment