



Shiba Inu has effectively hit zero on two important technical achievements: sustained recovery above its short-term trend and meaningful progress toward its long-term moving average. After the explosive late-July attempt to reverse, SHIB has surrendered almost the entire move and returned to approximately $0.00000448.
The first critical threshold is the 50-day moving average. SHIB briefly surged through it during the late-July volatility spike, reaching approximately $0.0000058 at the session’s extreme. That breakout ultimately produced zero lasting progress.
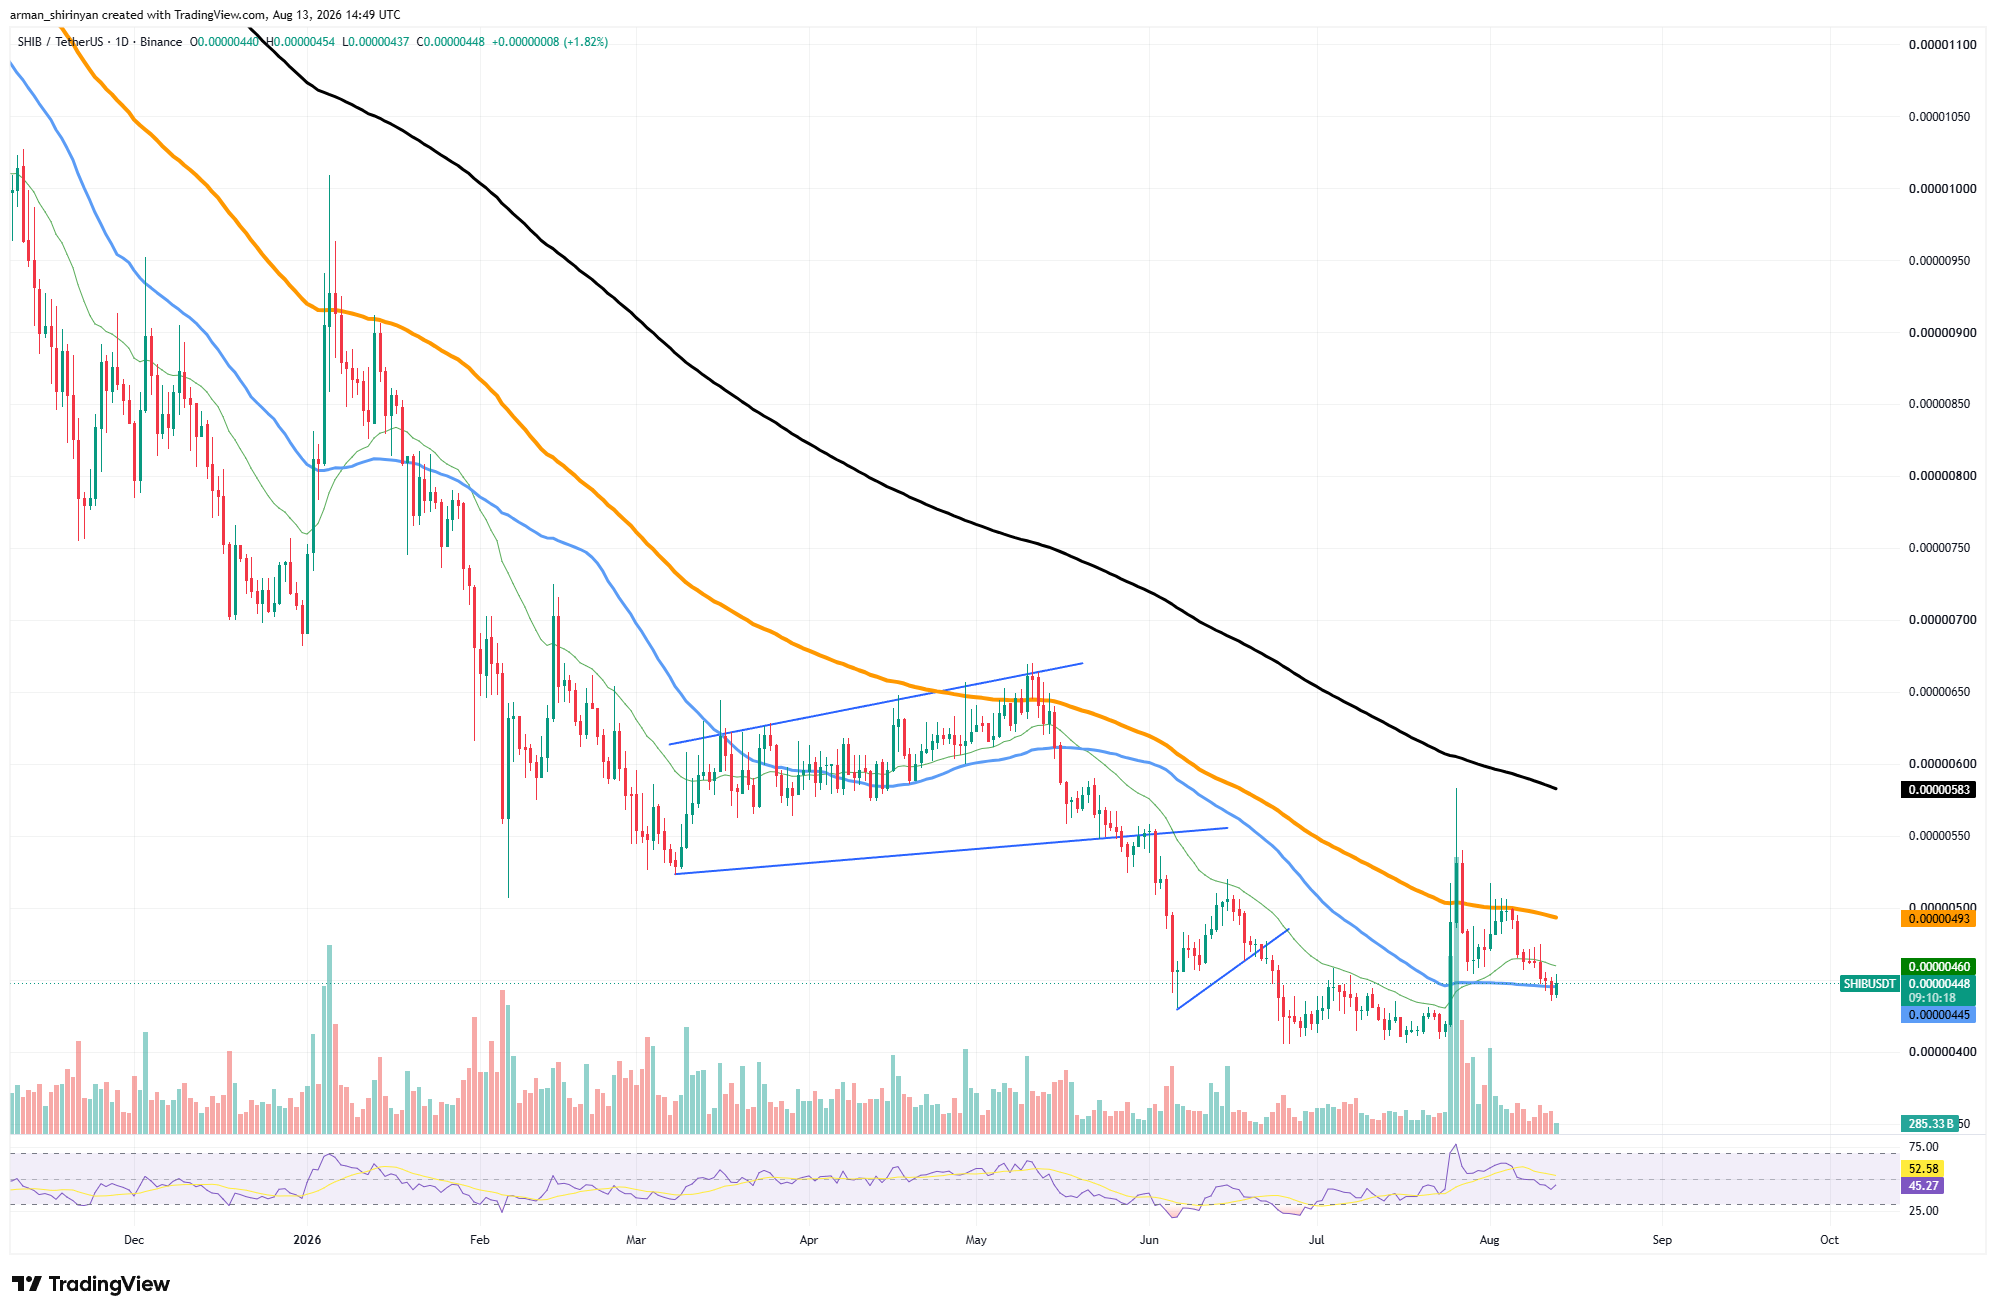
The 50-day average now sits around $0.00000445, almost exactly where SHIB trades. Instead of converting the moving average into support and building upward, the token has returned to the same technical boundary it was attempting to escape.

The second threshold is the 100-day moving average around $0.00000493. Here, SHIB’s progress has effectively been erased as well. Price briefly traded comfortably above this region during the spike but immediately lost it. The subsequent sequence of lower highs has now placed almost 10% between SHIB and this resistance.
That leaves the token with no confirmed medium-term breakout despite one of its strongest individual daily moves in months.
The broader structure explains why this matters. SHIB’s 200-day moving average remains around $0.00000583 and continues declining. Price has not established a sustainable challenge of this level throughout the recent recovery attempt, leaving the long-term trend decisively bearish.
Momentum is also fading. RSI has fallen toward 45 after briefly moving into overbought territory during the July surge. The indicator’s average remains higher around 52.6, showing how quickly the latest burst of momentum has dissipated.
There is one level SHIB has successfully protected: the approximately $0.0000041-$0.0000043 bottom established through June and July. As long as that floor remains intact, another recovery attempt remains possible.
Ethereum at the key state
Ethereum is approaching one of its most important technical shifts of 2026 as its moving averages begin forming a potential pre-golden cross setup. ETH has not confirmed the bullish crossover yet, but the gap between its major trend indicators is narrowing after months of overwhelmingly bearish positioning.
ETH currently trades around $1,890, almost directly between several moving averages. The 100-day moving average sits near $1,920, while the 50-day average has climbed to approximately $1,818. The shorter-term average is already around $1,877, reflecting the improvement in price momentum since Ethereum bottomed around $1,500-$1,600 in June.
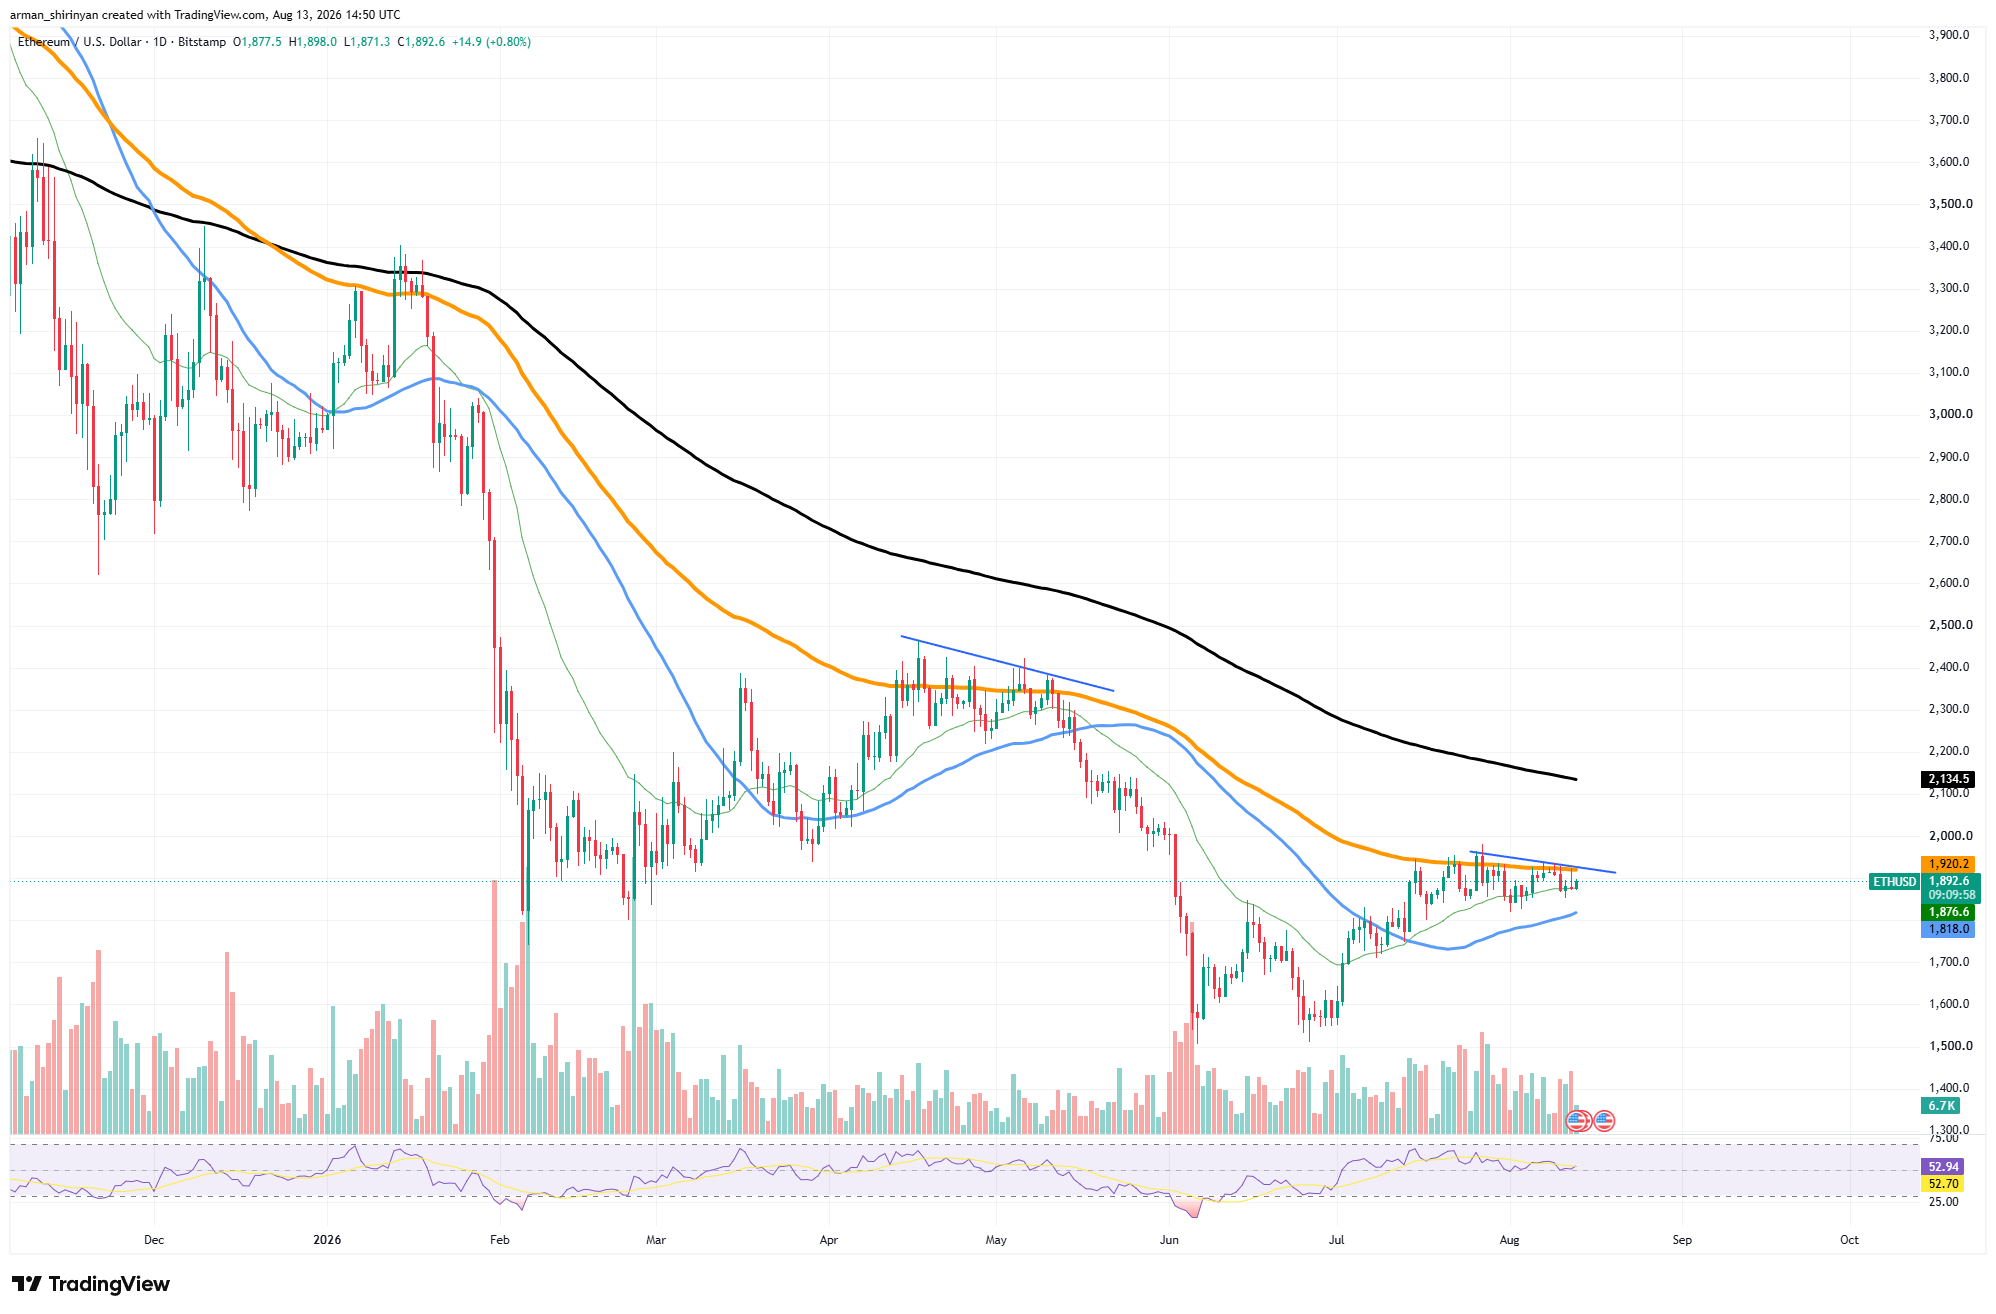
The important development is the direction of the 50-day average. After declining for months, it has turned upward and is now beginning to converge with the still-descending 100-day average.
That creates the conditions for a bullish crossover if Ethereum can maintain its recent price range or move higher. Such a crossover would signal that medium-term price action is improving faster than the older data incorporated into the 100-day trend.
There is a catch: ETH remains underneath the 100-day average itself. Price has repeatedly tested the $1,900-$1,950 region since July without establishing a decisive breakout. That makes this resistance zone particularly important. A move through $1,920 and sustained trading above it would strengthen the probability that the moving averages eventually complete their crossover.
Momentum is relatively balanced. RSI sits around 52.6, placing Ethereum slightly on the bullish side of neutral without indicating an overheated market. This gives ETH room for additional upside if buyers return.
The larger trend has not reversed completely either. Ethereum’s 200-day moving average remains much higher at approximately $2,135 and continues declining. Even a successful 50/100-day crossover would therefore represent an intermediate recovery signal rather than confirmation of a new long-term bull market.
Hyperliquid breaking out
Hyperliquid is attempting its strongest short-term recovery in weeks, with HYPE breaking above an important moving-average cluster and returning to approximately $58. The move gives buyers their first meaningful technical advantage since the asset started correcting from its summer highs, although $60-$61 remains the barrier that could determine whether the breakout develops further.
HYPE currently trades around $58.04 after gaining roughly 3.5% during the latest daily session. More importantly, the price has moved above the short-term moving average near $56.93 and the 100-day moving average around $56.66.
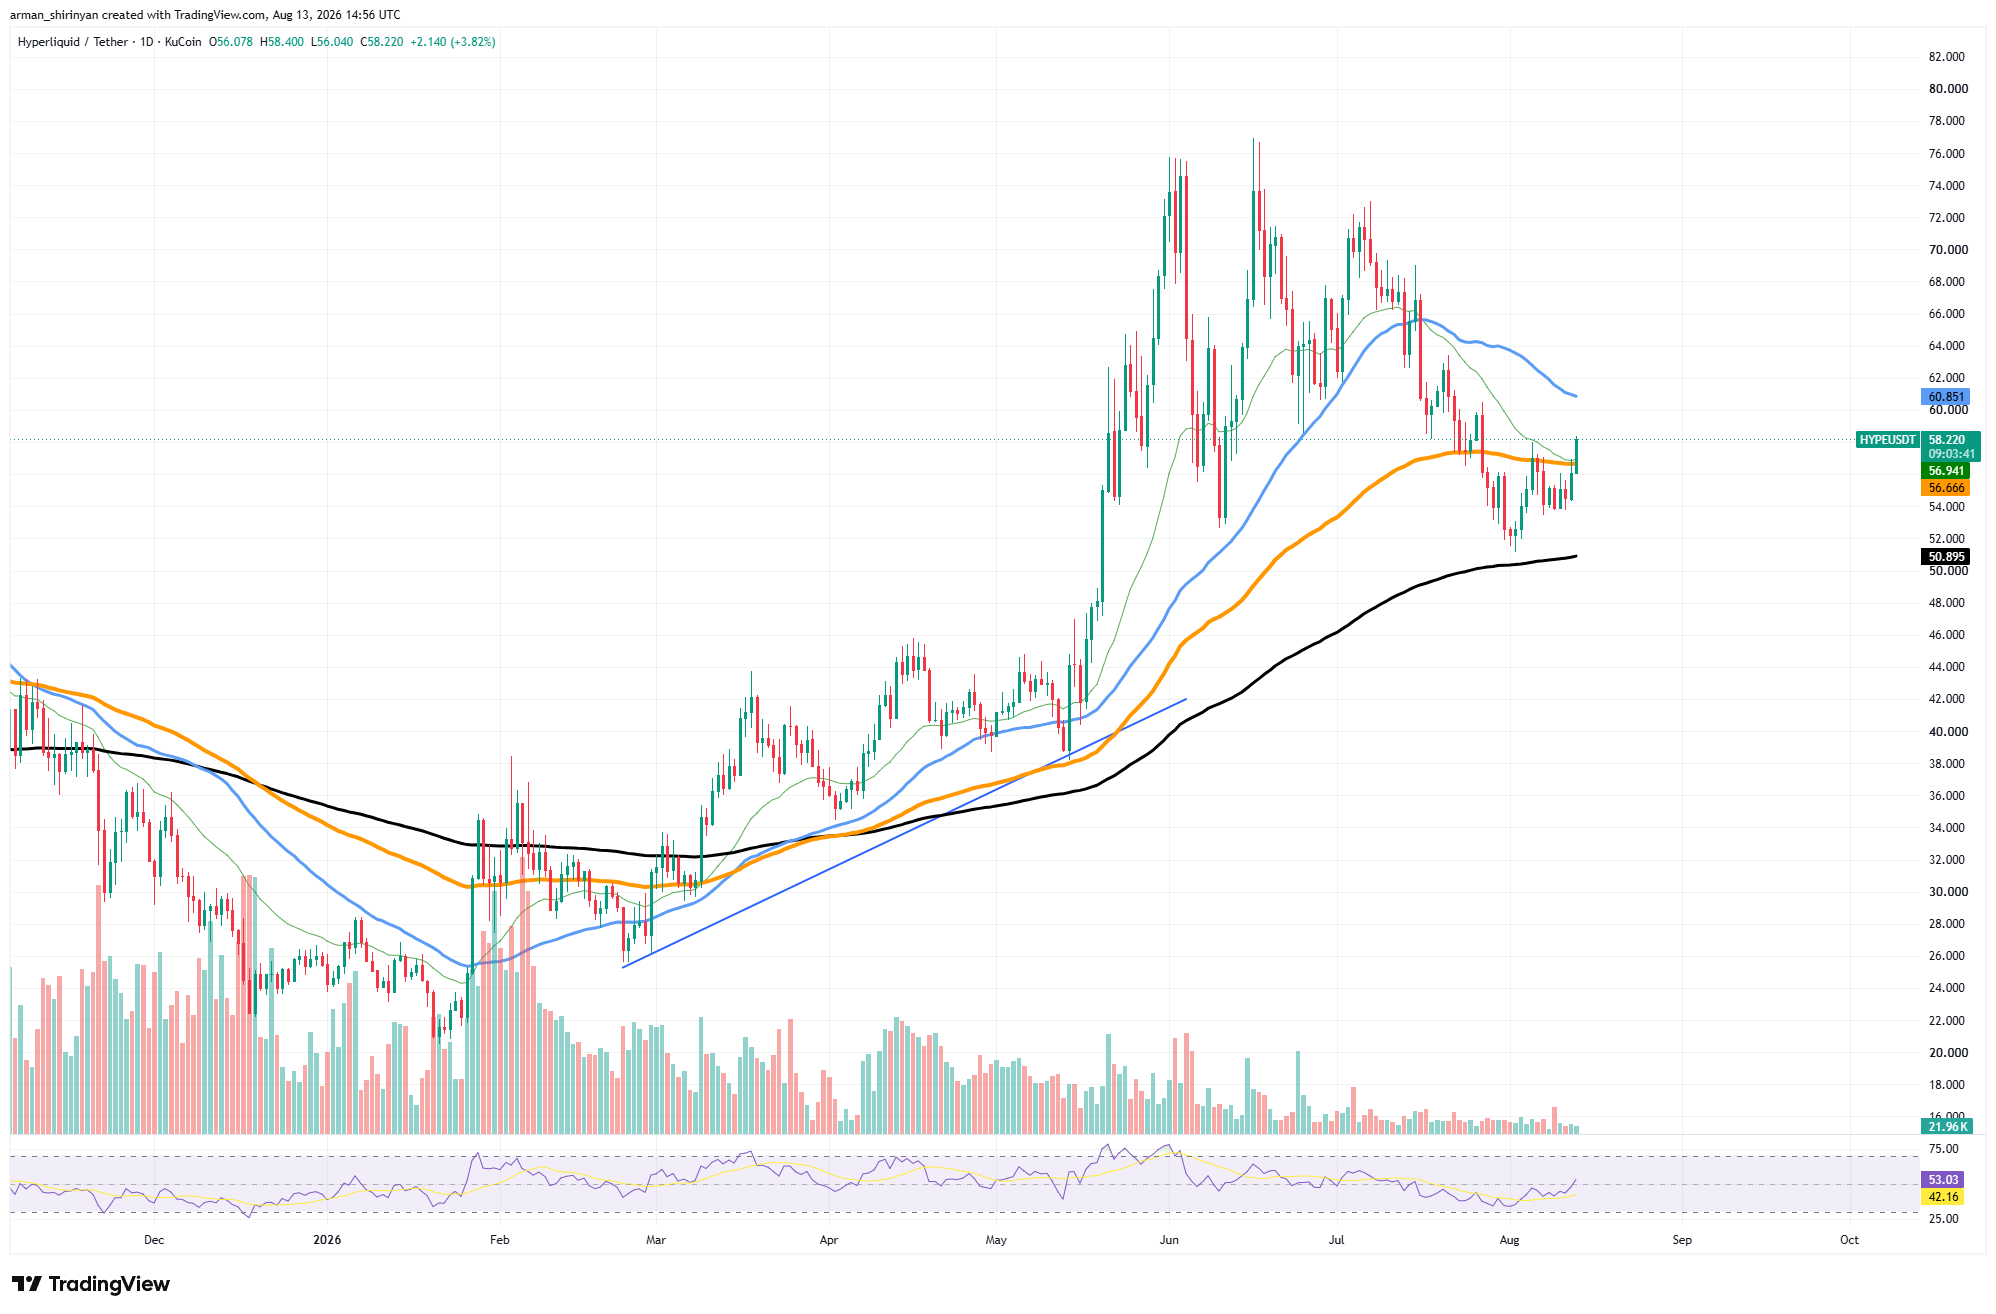
That area had repeatedly restricted HYPE during its recent consolidation. Moving through it turns approximately $56-$57 into the first level buyers will want to defend.
Momentum is improving alongside price. RSI has recovered to approximately 52.6 after spending recent weeks below neutral territory. Its signal average remains much lower around 42, highlighting the relatively rapid change in short-term momentum.
The next resistance, however, is already close. HYPE’s 50-day moving average sits around $60.85 and continues sloping downward. A push through approximately $60-$61 would therefore carry considerably more technical weight than the current breakout.
The broader structure also gives buyers some protection. The 200-day moving average has climbed to approximately $50.89 and remains well below the current price. HYPE tested the low-$50 region during its August correction without losing this long-term support.
HYPE is therefore beginning to break out of its immediate recovery range, but confirmation still sits overhead. Holding above $56-$57 would preserve the latest improvement. Clearing $60.85 would provide much stronger evidence that the correction from the $70-plus region has run its course.
For now, Hyperliquid has broken through the first barrier. The next one will determine whether this is merely another bounce or the beginning of a larger recovery.



Be the first to comment