


What to know:
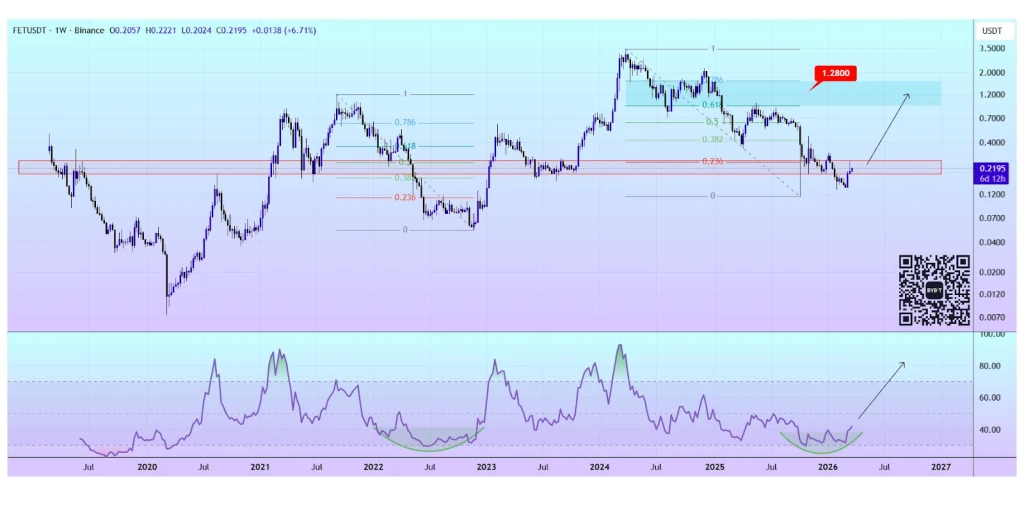
- Fetch.ai (FET) shows early bullish reversal signs after reclaiming a key resistance level, with $1.28 seen as the next major target.
- FET moved above the 20, 50, and 100-day EMAs, signaling a possible shift from a long downtrend to a recovery phase.
- RSI above 50 and a positive MACD support a bullish outlook, though momentum is slightly slowing.


Fetch.ai (FET) is starting to attract traders’ attention after showing early signs of a possible bullish reversal. According to crypto analyst Alex Clay, the token has recently moved back above a key technical zone, a level that previously acted as strong resistance.
Reclaiming this area suggests buyers are regaining control, while the RSI indicator flashing oversold signals adds to growing optimism among short-term traders.

Source: Alex Clay’s X Post
With momentum slowly improving, analysts are watching the $1.28 level as the next important target. This zone previously acted as a strong rejection point, so a move toward it could confirm strengthening bullish pressure.
If FET holds above the reclaimed support, the current setup may develop into a larger recovery, though market volatility remains a risk.
Also Read: FET Correction Tests Support Levels, Bulls Eye $0.30 Target Quickly
FET Technical Outlook Points to a Recovery Phase
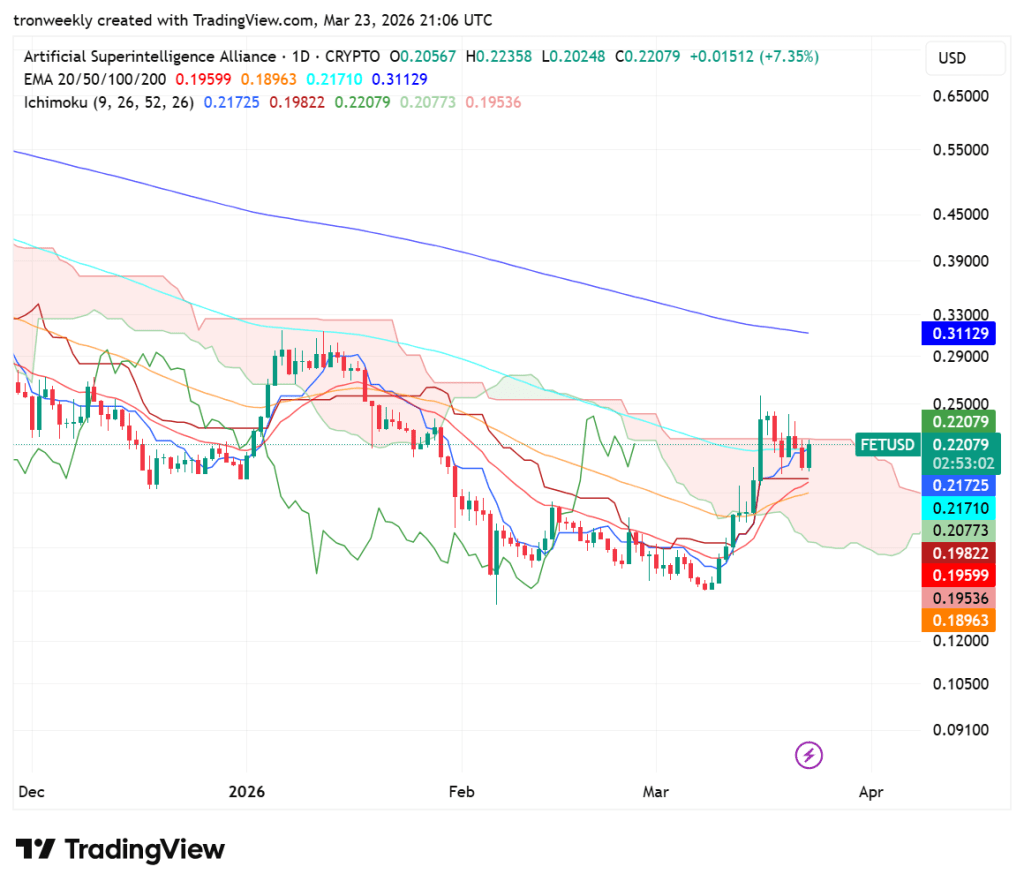
According to TradingView, FET appears to be changing gears from an extended period of decline to the spark that may propel it to a possible reversal.
Having spent several months below the 200-day EMA, FET’s price has recently surged upwards to reclaim the 20-day, 50-day, and 100-day EMAs.
This suggests that buyers are starting to emerge, even though the significant resistance at $0.311 acts as a barrier to a complete reversal.
Source: TradingView
The Ichimoku Cloud is indicating a neutral to bullish bias as price battles to trade above the Kumo. With Tenkan-sen and Kijun-sen offering immediate support at $0.21, the thin Ichimoku Cloud suggests that price is due for some wild swings soon.
FET has to break through the resistance at $0.25 to ascertain that this upward move has the strength to continue.
Momentum Indicators Reinforce Strong Bullish Outlook
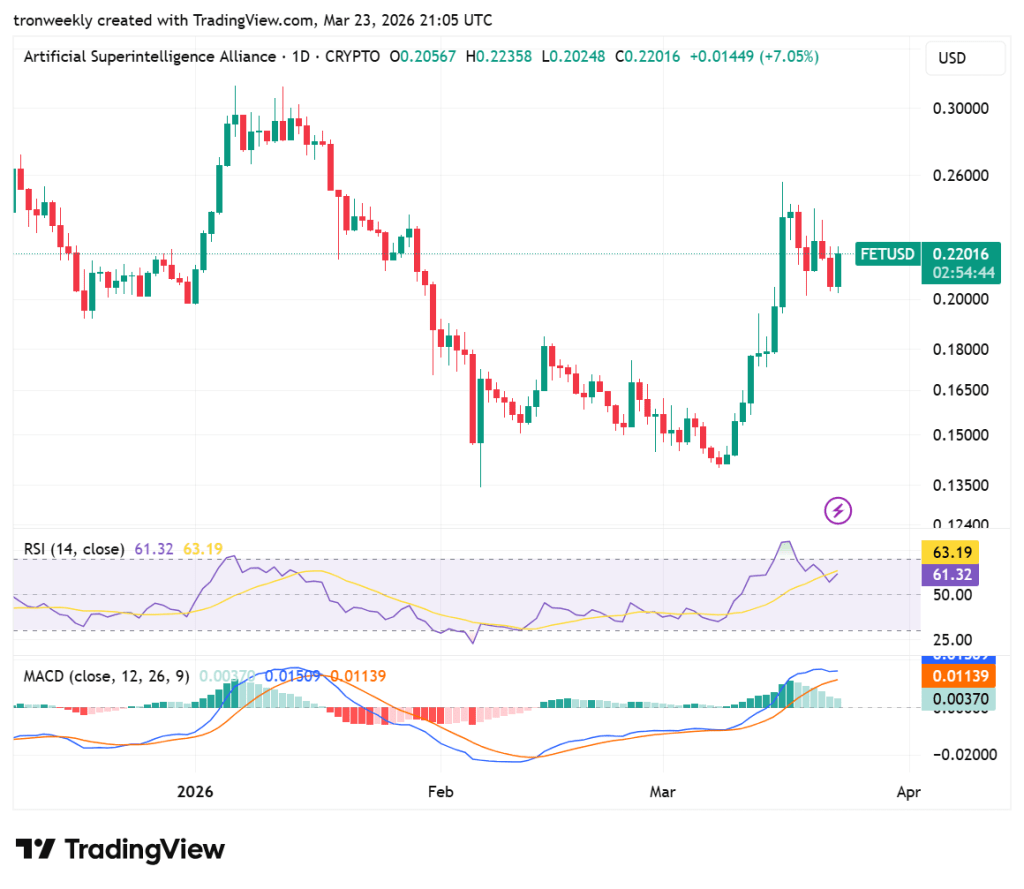
The RSI reading is 61.32, which is nestled nicely underneath its signal line at 63.19. While it remains well above 50, giving it a bullish lean, the shape of the line suggests that the momentum is slowing.
It is not in an overbought position, which gives it room to possibly rise further if the bulls can take charge and propel it towards resistance.
Source: TradingView
The MACD indicator has a bullish signal, with the blue MACD line currently at 0.01509, which remains above the orange signal line.
The green bars indicate a strong upward trend, but the shortening of the green bars indicates a weakening trend. Traders should look out for a possible bearish crossover if the price does not move up in the coming days.
This article contains market analysis and price predictions. These are not guarantees. Crypto markets are volatile. Always DYOR. Not financial advice.
Also Read: Fetch.ai (FET) Bullish Breakout Above $0.20 Could Trigger 4x Move Toward $0.85

Be the first to comment