


While the crypto market is searching for direction, Shiba Inu (SHIB) is showing signs that its period of dormancy may be coming to an end. If you look at the SHIB/USDT chart on TradingView, it is clear that the asset has found firm ground above the 50-day and 23-day moving averages and may be preparing for a local reversal.
Over the past few weeks, SHIB has been trading in a rather dull sideways range, but it is often during such phases that energy builds for the next move. The price is currently around $0.00000615, and the technical picture looks more interesting than it may seem at first glance.
Why $0.0000084 target is back on radar
First of all, a double signal of strength has appeared, as the RSI indicator has printed a bull mark twice over the past month. This suggests the emergence of a double bullish divergence, when selling pressure begins to fade and buyers slowly start to accumulate the coin.

The chart also shows how the price broke out of a narrow range above the $0.00000504 level. If it manages to hold here on the higher time frame, the first serious target will be the resistance zone around $0.00000662.
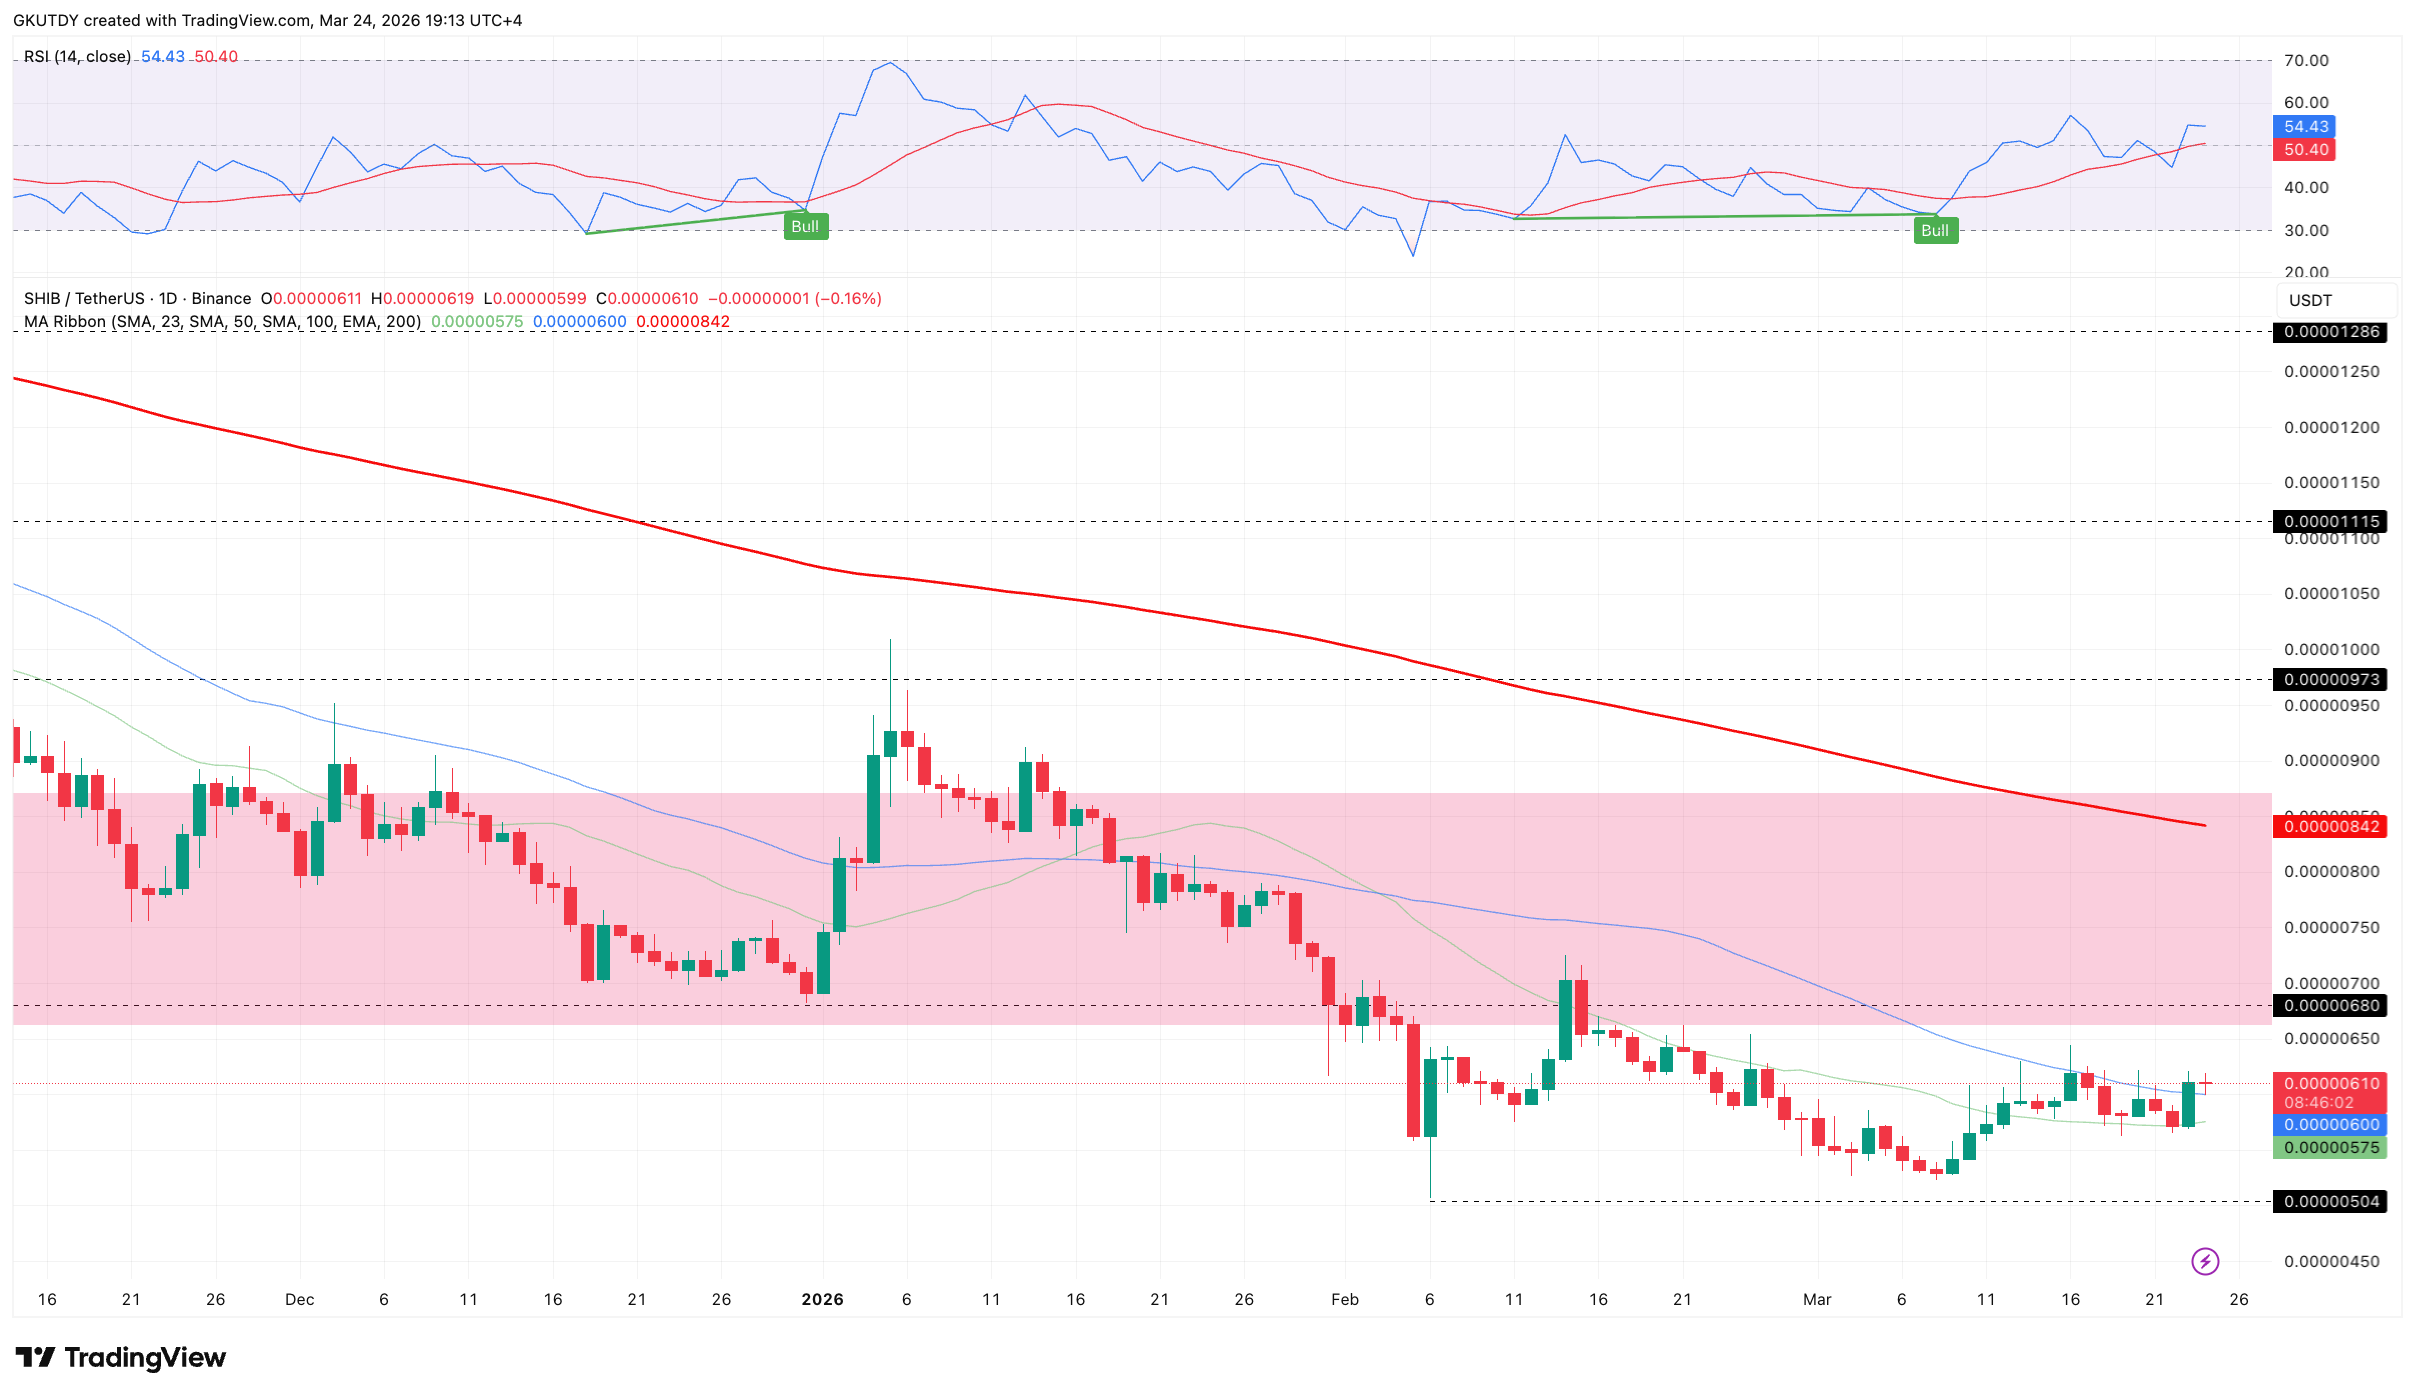
The main target for bulls, however, is currently located at the 200-day moving average. This stands at around $0.00000842. The distance from current prices is approximately the same 37%.
You Might Also Like

Of course, there are no guarantees in crypto, and SHIB remains highly dependent on overall market sentiment. However, the current chart structure with higher lows throughout March looks promising.
If the coin breaks above the $0.0000068 level by the close of the first quarter, it could trigger a wave of buying and a rapid move toward the target. For those tracking Shiba Inu, the critical support remains at $0.00000504. As long as the price stays above it, the growth scenario remains the priority.

Be the first to comment