


Disclosure: This article does not represent investment advice. The content and materials featured on this page are for educational purposes only.
SimpleSwap report finds Bitcoin sell-offs are drawing weaker stablecoin inflows as market fear loses its impact

Summary
- Bitcoin’s February sell-off triggered a 600% surge in stablecoin inflows, while June’s deeper slide drew little safe-haven demand.
- SimpleSwap data shows Bitcoin’s stablecoin flow correlation flipped from -0.54 in Q1 to +0.18 from April to June.
- Swap activity reveals investors reacted far less to Bitcoin’s June drop, suggesting repeated market shocks may be losing their impact.
Bitcoin fell 17.5% in February, and money ran for cover. It fell 15.7% in June, and almost nothing moved. SimpleSwap tracked 26 weeks of swap flows, then two rival platforms went and checked their own books.
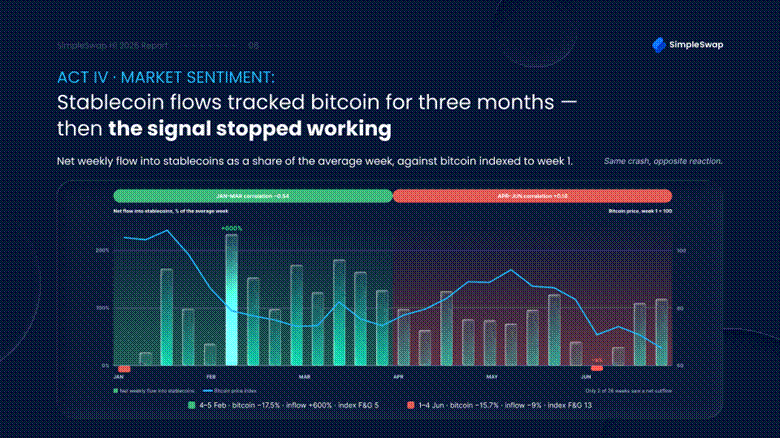
Over 36 hours on 4 and 5 February, Bitcoin fell 17.5%. Stablecoin inflows on SimpleSwap ran 600% above their weekly average in a single day.
Over 70 hours from 1 to 4 June, Bitcoin fell 15.7%. The same flows came in 9% below average.
Two drawdowns, four months apart, separated by less than two percentage points of depth. Their responses differ by more than six hundred.
June was not the calmest month
The tempting explanation is that traders had less to fear by summer. The sentiment data says the opposite. The Crypto Fear & Greed Index printed 5 during the February episode, the lowest reading in its history, and in June it bottomed in the low teens at almost identical depth. By Alternative.me’s count, the index spent roughly two of every three days of the half in Extreme Fear.
The market gave nobody a reason to relax. Spot volume on the top centralized exchanges fell from about $9.5 trillion in the second half of 2025 to roughly $4.65 trillion, according to CoinGecko, while total capitalization ended the half near $2.1 trillion. June was a muted response in a frightened market—stranger, in some ways, than a calm one.
That gap is what the H1 2026 Swap Report, published this week by SimpleSwap, examines. Using swaps, the report shows a part of the market that order books do not capture: what people actually chose to do next, at the moment they did it.
The relationship did not weaken; it inverted
Through the first quarter, the textbook held. Weekly net stablecoin flow correlated with the level of Bitcoin at −0.54. Price down, money into safety.
From April through June, the same coefficient reads +0.18.
“The first drawdown of a cycle is news, and people act on news,” said Stefan Lauer, Head of Infrastructure at SimpleSwap. “The third one of comparable size is weather, and nobody rearranges a portfolio because it is raining again.”
Then two competitors checked their own books
A single aggregator is a sample of the market rather than a measure of it, so the report presents other people’s numbers alongside its own.
SwapSpace recorded inflows 61% above baseline in the February episode, then fell to 9.3% below baseline by June, with its weekly correlation moving from −0.33 to +0.04. That is the same flip, but with a smaller amplitude.
Swapzone confirms February, when stablecoin swaps ran more than 50% above a normal week, and complicates June, when a few individual stablecoins pulled back while total stablecoin volume remained more than 10% above baseline.
“Both platforms confirm the surge, and only one confirms the fade, which is the honest state of the evidence,” said Rick Cramer, Head of Analytics at SimpleSwap. “Any analyst who takes the finding seriously will go looking for exactly that boundary, so leaving it out would have been the fastest way to lose them.”
One weekly detail sharpens all of it. Across 26 weeks, exactly two produced a net outflow from stablecoins. One was the first week of January. The other was the first week of June, the week containing the deepest Bitcoin drawdown of the half. In the worst week of the period, no money arrived in the safe asset.
What to do with a broken indicator
If we consider the influx of stablecoins as an indicator of fear, the premise changes. This signal does not behave like a constant, but rather like something with a half-life: it is most pronounced at the first shock of the cycle and weakens with each repetition. The real test is to compare the reaction with the scale of the fall, and not with the previous reaction. The lack of influx late in the cycle does not prove that people have calmed down.
Five more findings, and where they lead
The rest of the report turns on divergences between the market and the platform, and each is worth reading with the tables in front of you.
Bitcoin dominance broke above 60% in the spring while the platform’s combined Bitcoin and Ether share of volume moved the other way, which sets up an argument about why a stock measure and a flow measure disagree during a sell-off.
Swap volume fell by a third compared with the second half of 2025, while transaction count fell far less, and the section explores what the gap between the two suggests about who stayed.
Stablecoin supply held near $310 billion through the half while Visa’s Allium-powered dashboard logged $1.79 trillion of adjusted transfer volume in June, an all-time high. The platform’s flow data lands on the receiving end of that shift.
The platform made 268 assets routable — roughly ten a week — and the median one then waited about seven weeks before its first meaningful use. The fastest moved in only a small fraction of that time, and the gap between them is what the section really examines.
Cross-chain activity accounted for 91.8% of swaps and remained remarkably stable month to month. The more striking number sits underneath, in a table showing how far past the four largest networks the average swap now reaches.
The report ends with three observations, and none of them look like a price forecast. For analysts and media readers: it seems that panic has its own half-life; the breadth of listing looks more like insurance than advertising; and demand continues to shift not towards changing what you own, but towards changing where you keep it. The first of these conclusions will be tested in the second half of the year — a new drawdown of comparable depth will either confirm that the market reaction continues to fade, or show that it has reset to zero after a quiet period.
The full report comprises six sections and includes data contributed by SwapSpace, Swapzone, Rubic, and Near Intent, along with comments from Talisman Wallet and Kuvi.AI, noting where those partners disagree with the platform’s own reading.
About the report
The SimpleSwap H1 2026 Swap Report covers 1 January to 30 June 2026, benchmarked against the second half of 2025. Each section opens with a public market benchmark before any internal figure appears, drawing on CoinGecko for exchange volumes and capitalization, DeFiLlama together with Visa’s Allium-powered dashboard for stablecoin supply and settlement, Alternative.me for sentiment, and LI.FI plus Circle disclosures for cross-chain context. All figures are aggregated across swaps routed through the platform, and nothing in the report identifies a user, an address, or the timing of an individual transaction. Exactly one dollar figure appears in the text, and it is a measurement threshold rather than a platform total. The report describes past market behavior and contains no price forecasts.
Full report and methodology at SimpleSwap blog. Media and analysts can request additional data cuts at [email protected].
About SimpleSwap
SimpleSwap is a self-custodial multi-source swap aggregator. It draws liquidity from more than 20 CEX and DEX sources, covers 2,800+ assets, and handles provider and route selection under the hood. Over 8 years, 10M+ users have swapped through SimpleSwap, and 6,000+ projects use it as a business solution, including Exodus and Tangem. The only official SimpleSwap website is simpleswap.io.
Disclosure: This content is provided by a third party. Neither crypto.news nor the author of this article endorses any product mentioned on this page. Users should conduct their own research before taking any action related to the company.



Be the first to comment