


What to know:
- XRP stabilizes at $1.40 support, showing early signs of building a base after recent declines.
- Breaking above the $1.45–$1.50 resistance could signal rising buying power and a potential recovery.
- Technical indicators remain cautious: RSI below 50, MACD flat, and price below key moving averages.

XRP price is currently stabilizing as it corrects from the recent decline. It’s currently near key support levels and displaying early signs of building a base. Momentum levels are weak, and selling pressure continues. A move above nearby levels could indicate a move towards a potential recovery.
At the time of writing, XRP is trading at $1.39, with a trading volume of $3.16 billion and a market capitalization of $85.87 billion, according to the data from CoinMarketCap. The price of XRP has fallen by 3.46% over the last 24 hours, indicating that the selling pressure is still affecting the asset in the short term.

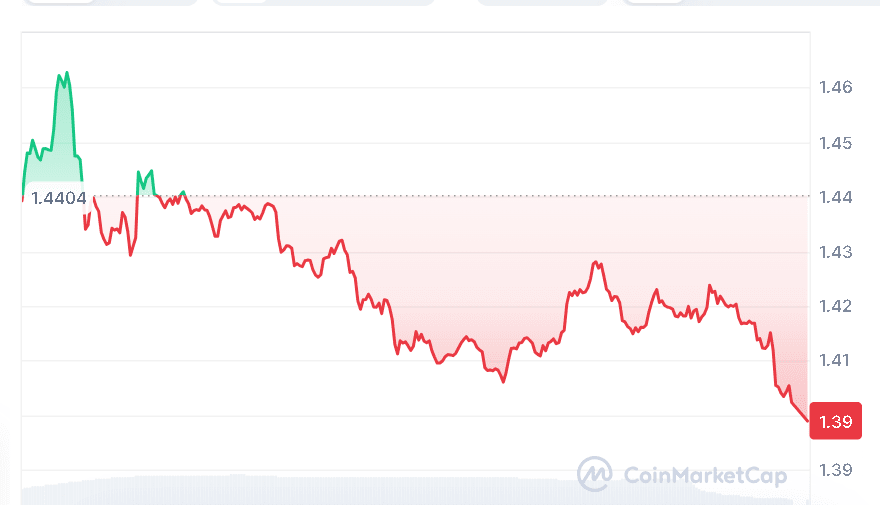

Source: CoinMarketCap
XRP Stabilizes Signals Potential Recovery
Crypto analyst, BitGuru, stated on March 24, 2026, that XRP is currently trading in a vital accumulation range. This comes after a long-term downtrend, followed by a breakdown from a falling wedge pattern. The recent price action indicates that XRP is building a base at the $1.40 level, which could be used as a base for a possible recovery.
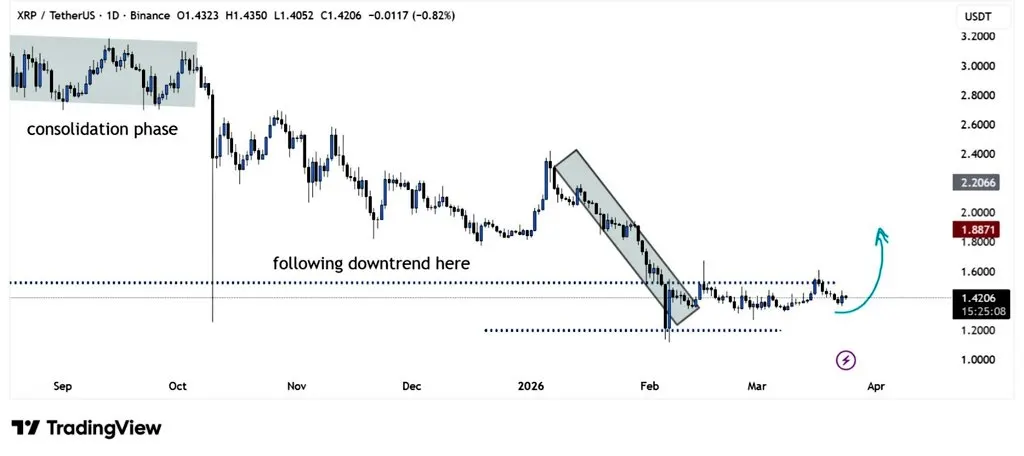

Source: BitGuru’s X Post
The price is currently trying to stabilize at this support level, and trading above it could help to boost short-term buying confidence again. Breaking above the resistance range of $1.45 to $1.50 could be a sign of rising buying power, which could lead to a move higher in the price.
XRP Indicators Signal Downside Risk
However, the technical indicators still point to a conservative outlook. The price of XRP is trading at $1.39, and its Relative Strength Index (RSI) is at approximately 46; this is still below the 50-neutral point.
Moreover, the moving average ribbon also displays a bearish pattern as the price continues to remain below key price levels, such as the 20-day moving average at $1.41 and the 200-day moving average at $2.09. This indicates that the selling pressure continues to dominate the market.

Source: TradingView
The MACD indicates that the lines are close to each other in negative territory with a flat histogram, reflecting low momentum and a consolidation phase. The lack of a bullish crossover also indicates that the risks of a fall have not completely gone away.
Also Read | RENDER Price Analysis: $2.71 Break May Signal Trend Shift
XRP Market Awaits Next Move
Overall, the price of XRP is currently stabilizing around a vital level of support. A price increase above this level of resistance could be a sign of a potential recovery, while a fall below this level of support could mean further losses in price. Investors are taking a wait-and-see approach to this market.
This article contains market analysis and price predictions. These are not guarantees. Crypto markets are volatile. Always DYOR. Not financial advice.
Also Read | Bittensor (TAO) Could Climb to $360 if $320 Resistance Breaks

Be the first to comment