


What to know:
- Zcash (ZEC) demonstrates growing stability as recent selling pressure eases, hinting at potential upward movement.
- ZEC is testing a critical breakout zone, suggesting chances for short-term price gains.
- Technical indicators, including MACD and RSI, signal early recovery and reduced selling pressure.


Zcash (ZEC) is showing signs of stability after recent declines, indicating that there is a chance for the cryptocurrency to rise in the short term. The cryptocurrency is testing a breakout point, and the early signs are showing selling pressure easing, indicating there is a chance for short-term gain.
At press time, Zcash (ZEC) is trading at $225.53, down 2.33% over the last 24 hours, with a 24-hour volume of $661.16 million and a market capitalization of $3.72 billion, according to CoinMarketCap. Analysts note that regaining structure above the breakout zone could signal a shift in short-term momentum toward the upside.


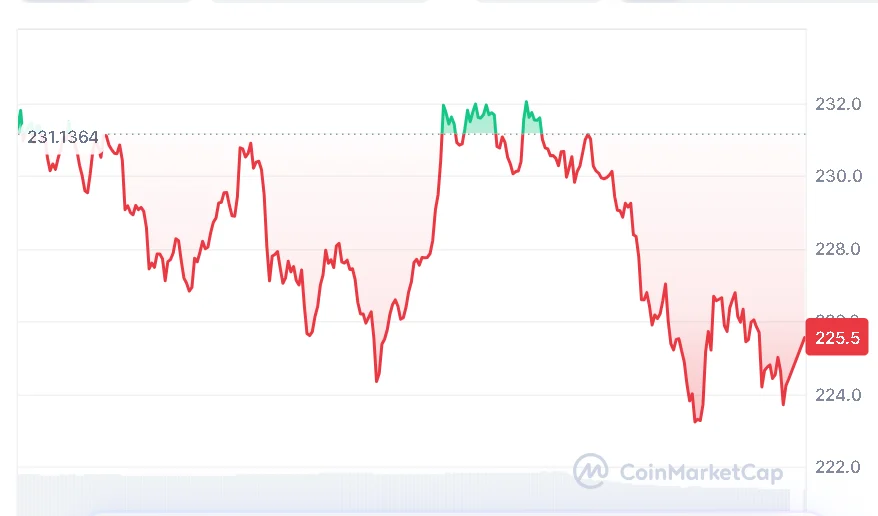
Source: CoinMarketCap
Zcash Tests Breakout Amid Recovery
On March 24, 2026, a crypto analyst, Alpha Crypto Signal, noted that ZEC is currently testing a breakout zone from a symmetrical triangle formation. After a slight pullback, ZEC is showing signs of a potential trend reversal with its current price action above a previous compression zone between rising support and falling resistance.

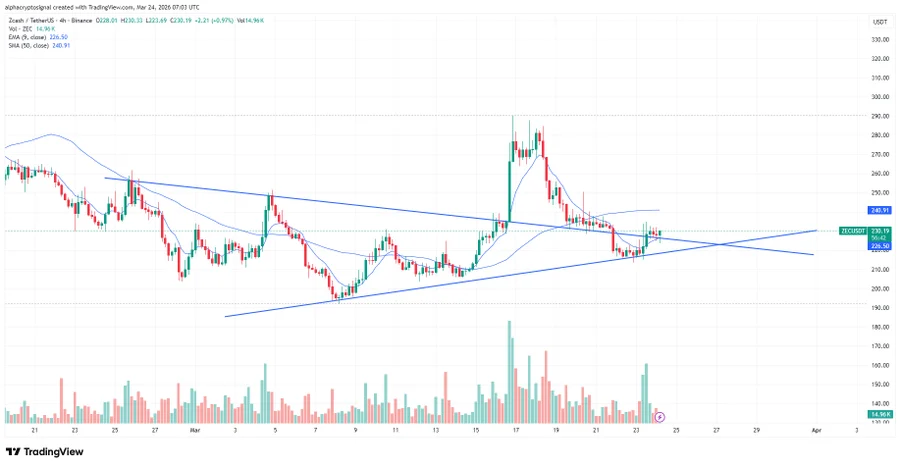
Source: Alpha Crypto Signal’s X Post
If the breakout level is sustained, there is a chance that there will be continuation moves, and dips may be good buy signals. The direction of least resistance is seen to be favoring growth, and there are cautionary trends. Investors are advised to watch the prices before entering the market.
ZEC Momentum Shows Early Recovery
RSI stands at 46.59, slightly below the signal at 47.80. The price remains close to the MA Ribbon. The 20-day MA stands at $224.98, and the 50-day MA stands at $239.32, which are the immediate resistances. The price also remains below the 100-day MA at $328.75 and the 200-day MA at $315.81, which are above the price.

Source: TradingView
The MACD is currently in negative territory, with the MACD line at -4.32 and the signal line at -5.57. However, the distance between the two lines is diminishing, and the histogram is now slightly positive at 1.25. This could be an indication that selling pressure may be subsiding.
Also Read | NYSE and Securitize Unleash Revolutionary Tokenized Securities Trading in 2026
Zcash Eyes Bounce as Breakout Level Holds
Although the price of ZEC has been under pressure recently, the technical indicators suggest that the market may be positioning for a bounce. If the price holds above the breakout level, it may be a sign of higher momentum in the coming days.
However, investors need to consider the regulations and laws that govern the market, such as the SEC and MiCA regulations.
This article contains market analysis and price predictions. These are not guarantees. Crypto markets are volatile. Always DYOR. Not financial advice.
Also Read | Fetch.ai (FET) Bullish Reversal Signals Potential Move Toward $1.28 Target
Be the first to comment