



Fetch.ai [FET] joined the broader market’s rally recently, with its gains of over 15% in just 24 hours pushing it to $0.15 on the price charts.
However, this rally might be likely to maintain its bullish trend in the short term. Especially since several market conditions in both the perpetual and spot markets suggested that it might have a strong foundation.
Long positions hold ground as retracement risk remains
FET’s perpetual market has held its ground lately, underlining a clear bullish outlook among traders, with most positions remaining long.
This long bias stems from the Open interest weighted funding rate which has remained positive and surged to its highest level since 20th June. In fact, it hit 0.0210% on the chart.

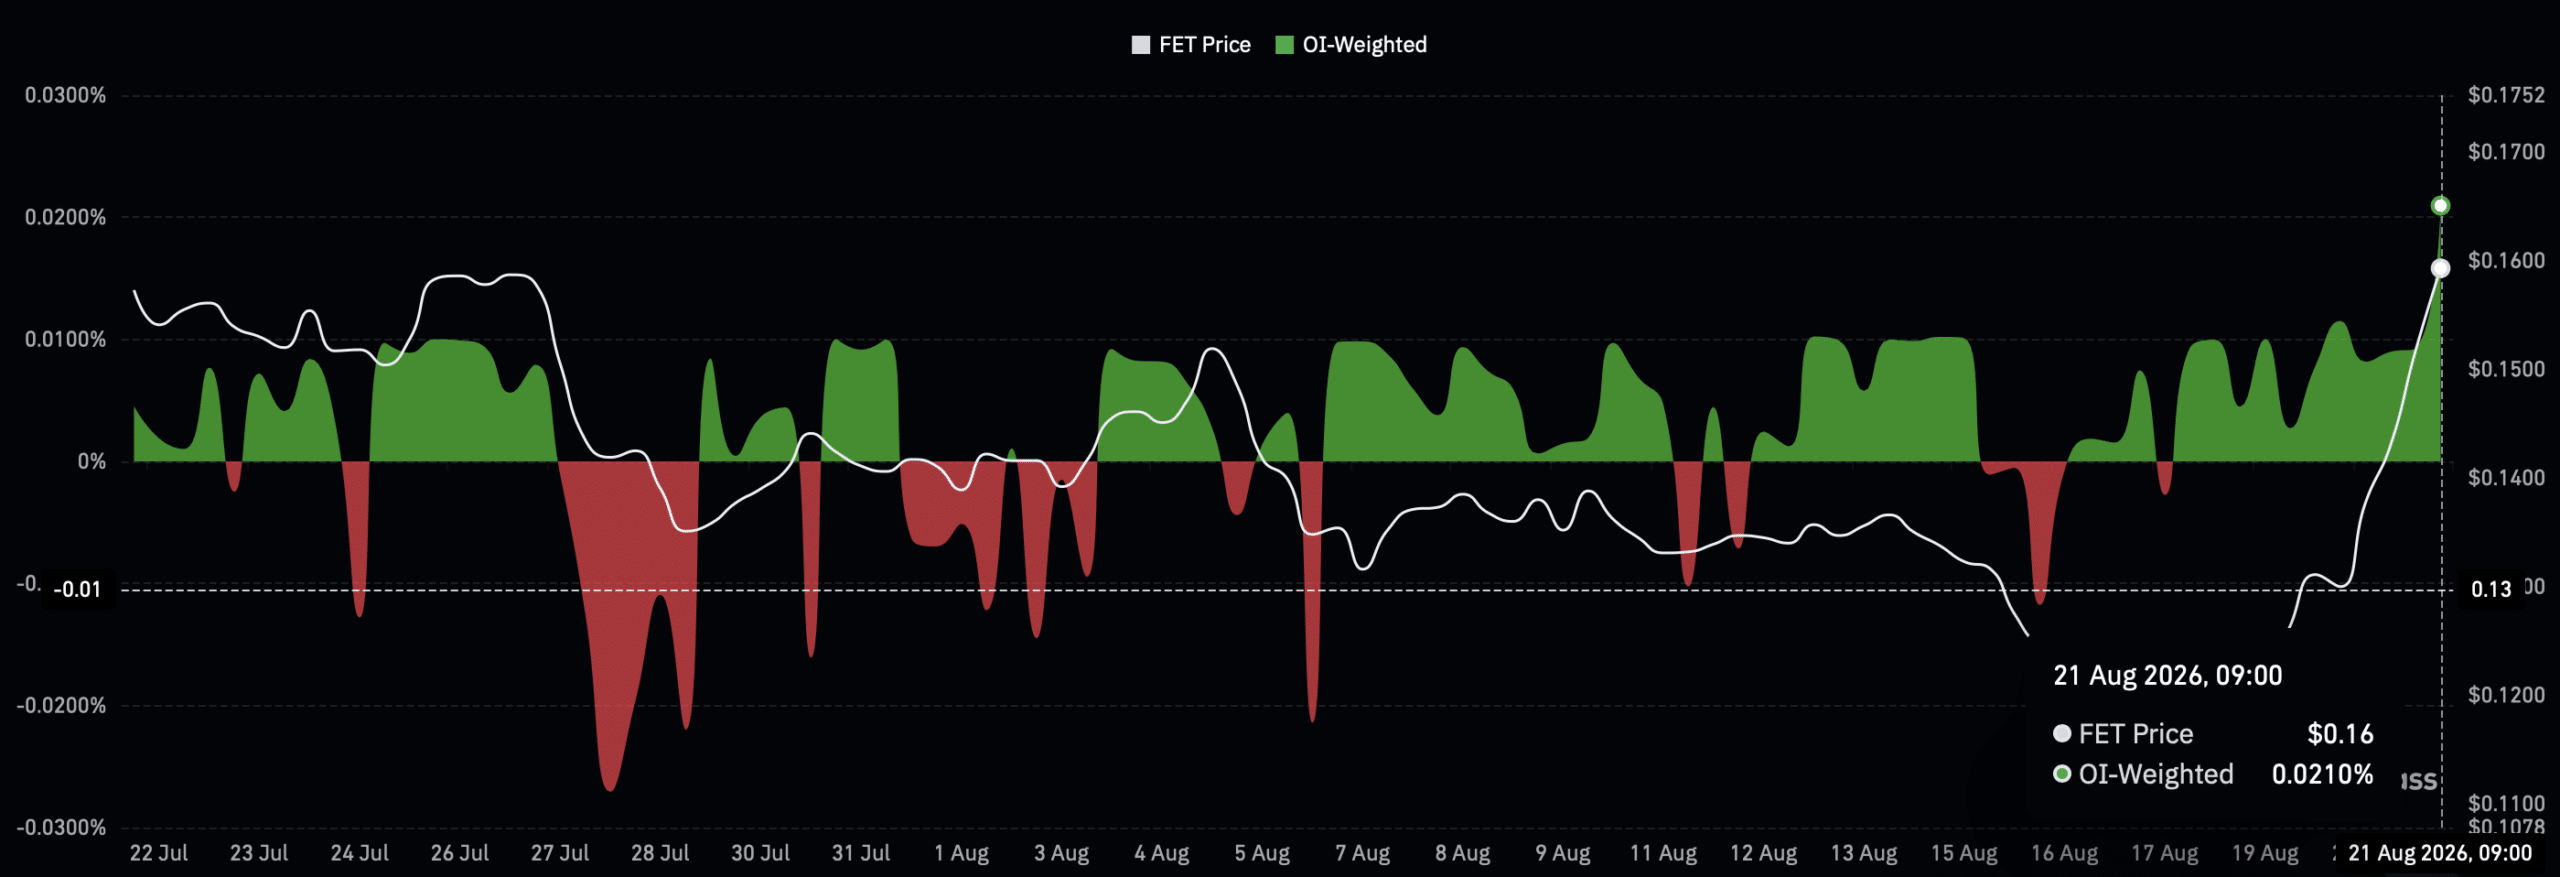
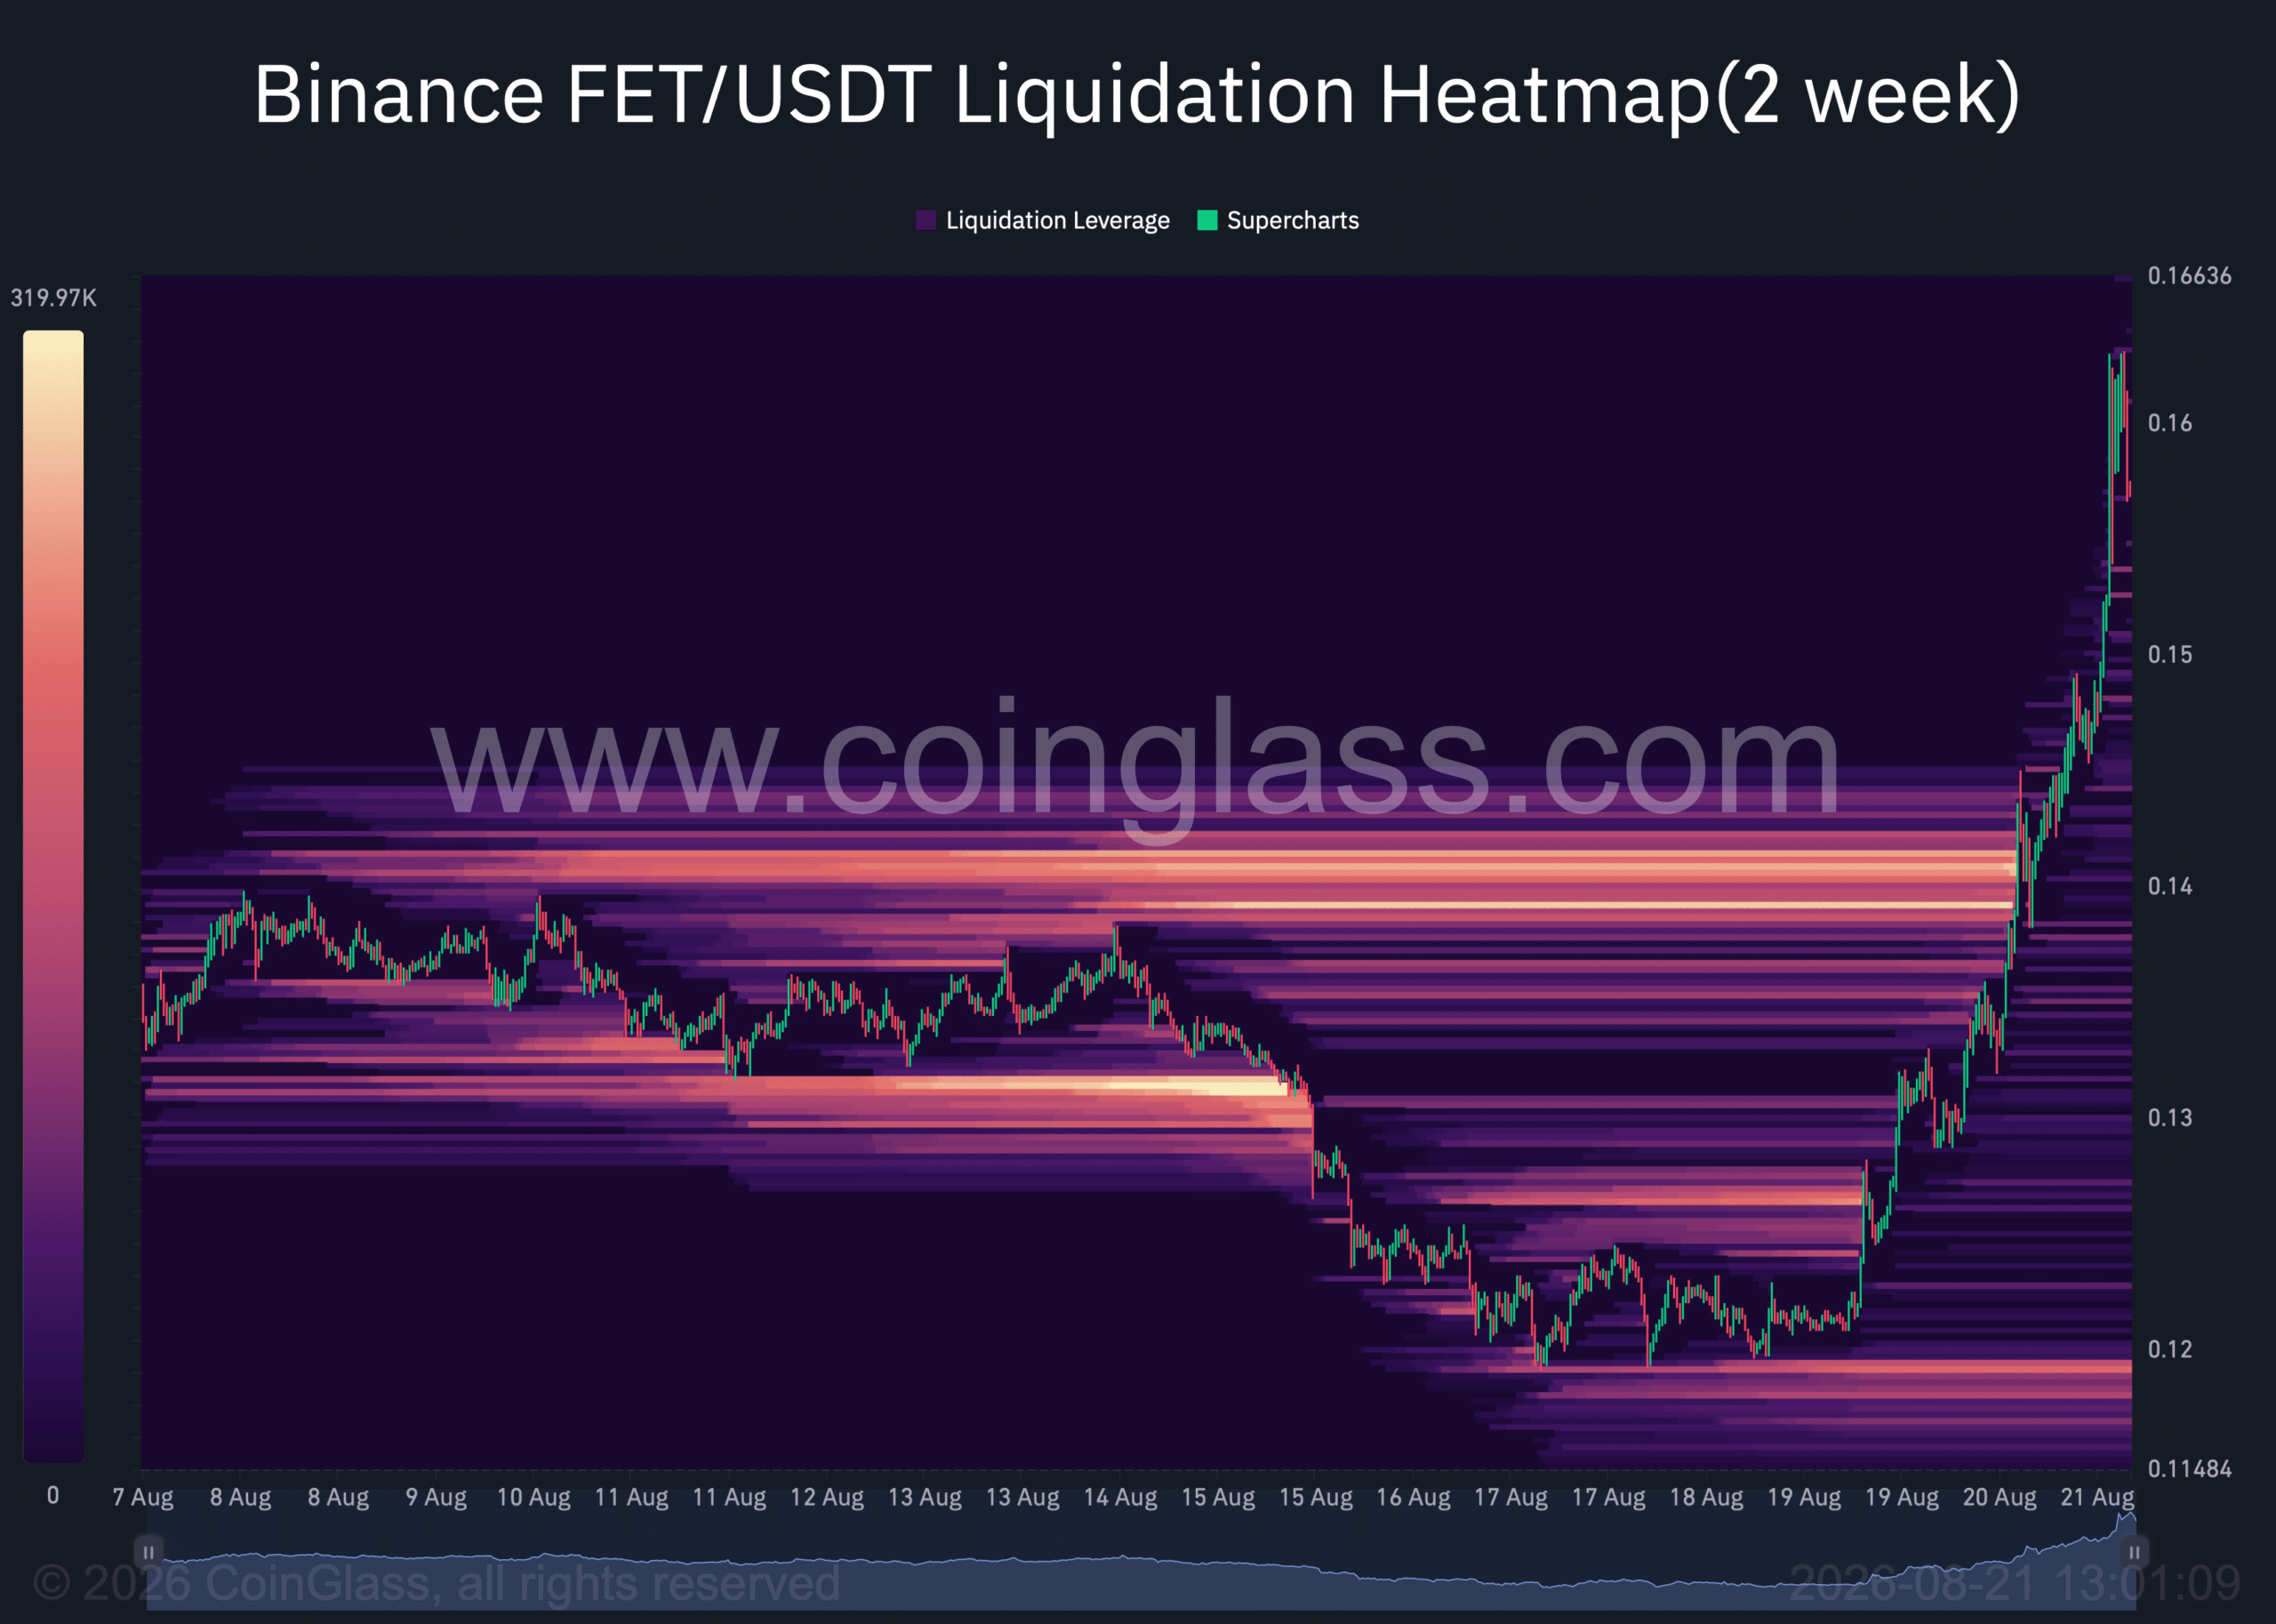
At the time of writing, the capital held in FET’s perpetual market was valued at $83.33 million Now, while the outlook seemed bullish, there is still a chance that the price could fall lower based on the liquidation heatmap.
The liquidation heatmap highlighted clusters around the $1.2-level, with buy orders at this level valued at roughly $500,000.
Buy-side orders tend to pull the price lower by acting as a magnet. However, the clusters at this level are not dense enough to exert significant pressure on the price.
Spot market adds to buying outlook
Traders in the spot market have so far exhibited stronger demand than sell pressure.
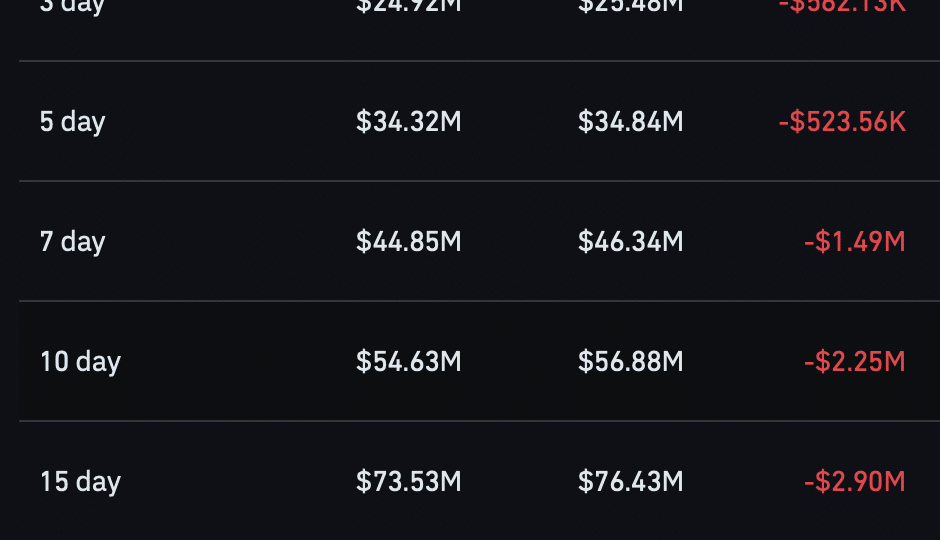
A total of $16.81 million worth of FET moved out of exchanges into private wallets, with netflows standing at -$296,690.
In fact, netflows have continued to grow, with the exception of the five-day netflow. Over the past 15 days, there has been a total of $76.43 million in buying activity, while netflows stood at -$2.9 million. Growing spot purchases like this are important for maintaining the bullish price trajectory.

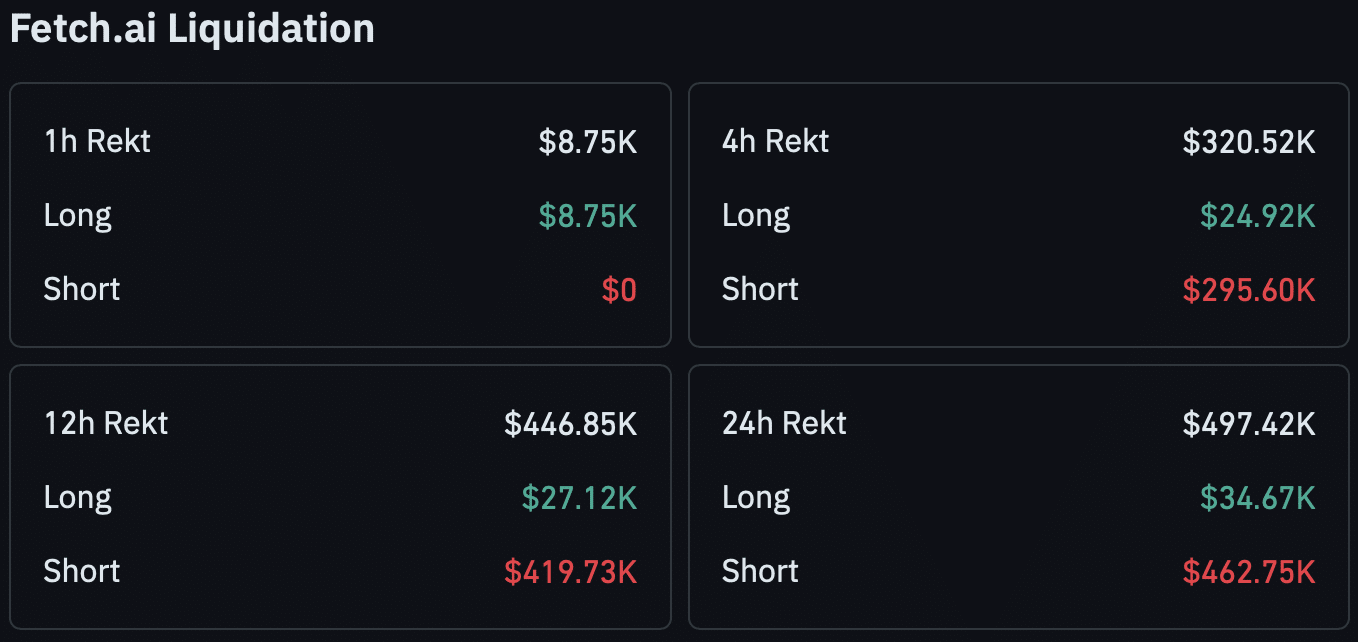
Interestingly, the prevailing trend has also increased the risk of traders betting against it. Liquidations in the market have widened significantly between short and long positions.
Short traders lost roughly $462,750, compared to $34,670 lost by long traders. In simpler terms, shorts have lost 13.3 times more than longs in the market.
Who is behind FET’s rally?
Whale involvement in the market has been high too. When whales have a bullish outlook, they tend to hold their assets for longer without selling into the market.
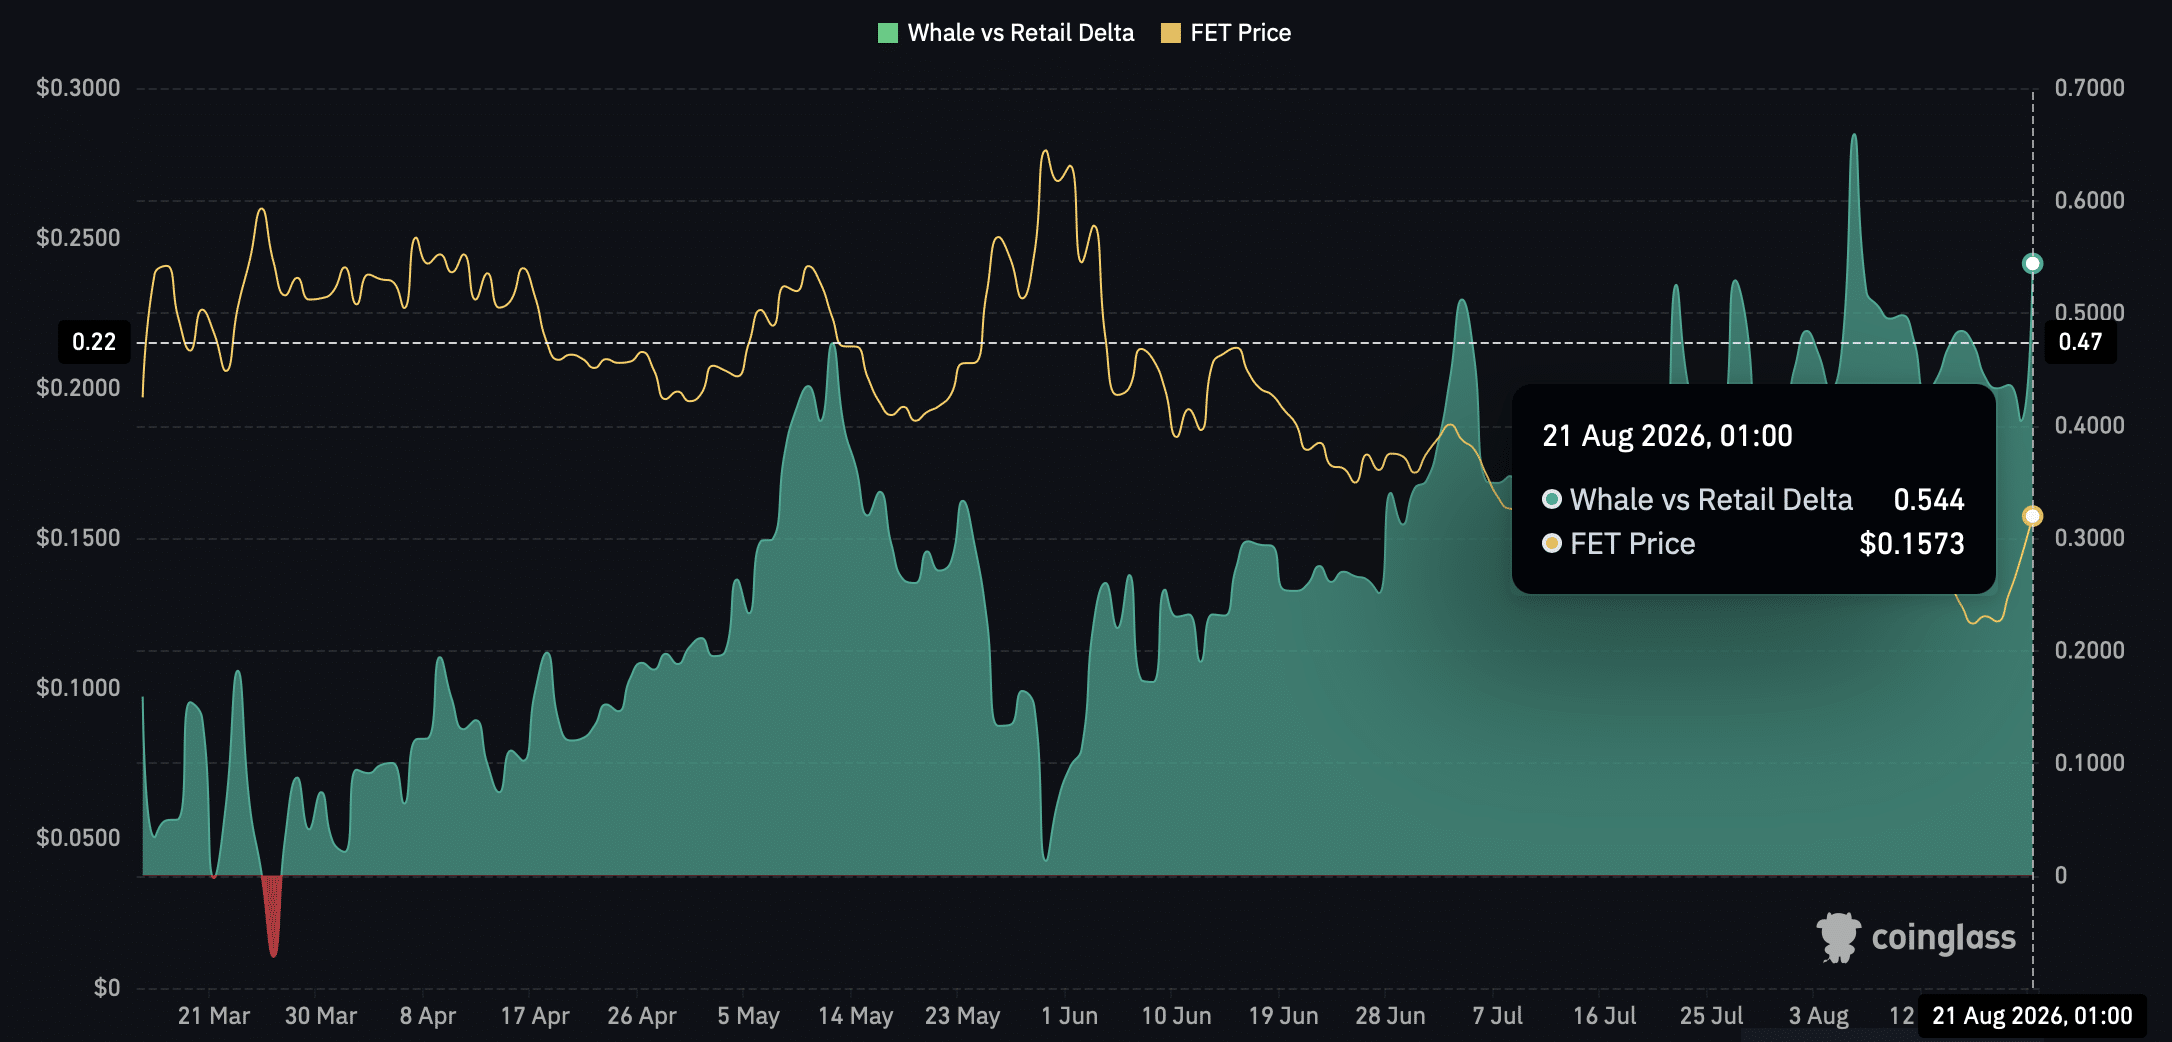
At press time, their behaviour suggested that the current uptrend could continue, potentially driving the price even higher on the chart.
Regardless, traders should tread carefully despite the recent surge.
Final Summary
- FET’s positive funding rate and strong spot demand have supported the asset’s bullish momentum.
- Short liquidations have far outpaced longs, while whale activity could help sustain the rally.



Be the first to comment