


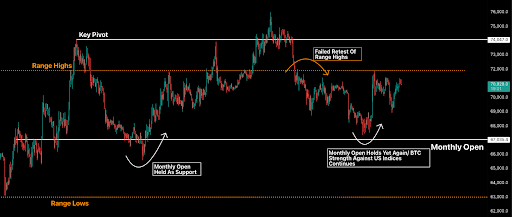
Bitcoin has spent this week staging a convincing defence of the $67,035 monthly open and, as of Wednesday, is pressing against the lower boundary of the $72,000–$82,000 air gap again. This is the zone of thin historical accumulation our analysts have identified as the most probable expansion target if sustained demand returned. The catalyst is geopolitical rather than macro. And the mechanism by which it operates reveals something important about how markets actually process conflict risk.
On Monday, President Trump announced a five-day postponement of planned strikes on Iranian power plants. Trump also underscored “very good and productive” conversations towards a “complete and total resolution.” Bitcoin surged 4.8 percent to an intraday high of $71,811, oil futures collapsed nearly ten percent, and Brent retreated from $112 towards $102, while the S&P 500 rose 3.8 percent.
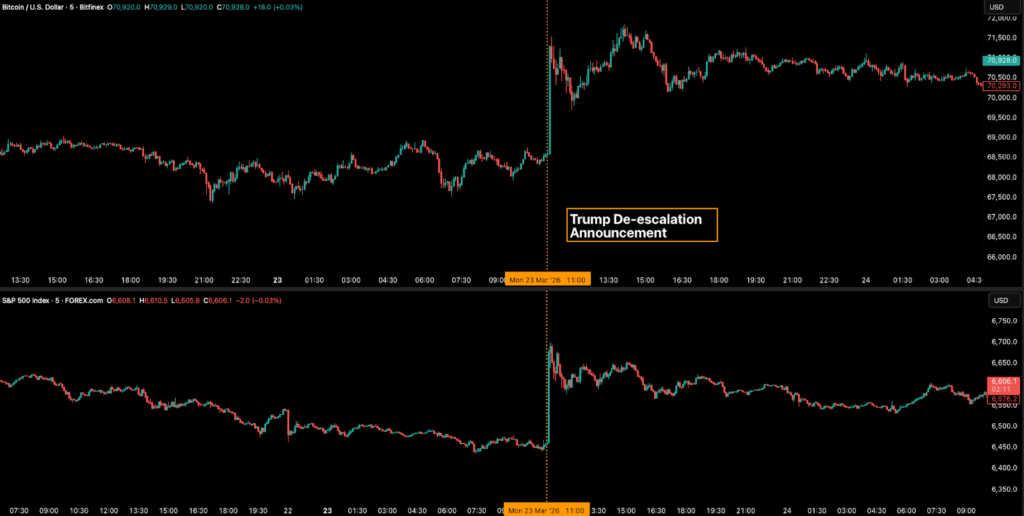
In relative terms, the S&P 500’s move was considerably stronger than bitcoin’s, reflecting how far equities had already weakened before bitcoin bottomed first, consistent with our earlier thesis on relative strength. On Tuesday, Iranian state media denied that any negotiations had taken place. Bitcoin barely flinched initially, holding above $71,000 before retracing to test sub-$70,000 demand levels once more, then resolving higher.
The core analytical conclusion is clear: the United States holds the decisive military escalation lever in this conflict. When the entity possessing the most potent destructive capacity signals a voluntary pause, markets instantly reprice the probability of resolution. This occurs regardless of whether Tehran officially validates the talks. Iran’s subsequent denial, while geopolitically relevant, remains market-irrelevant as long as the US maintains its de-escalatory posture. Trump administration’s capacity to de-escalate without requiring Tehran’s cooperation, by simply refraining from escalation, creates a pricing asymmetry the market is currently acting on.

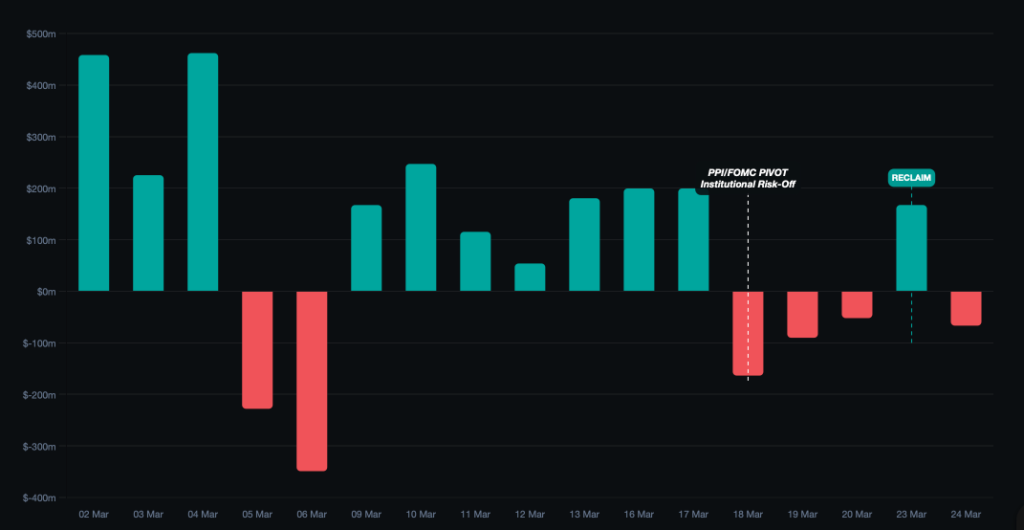
The exchange-traded fund (ETF) flow data illuminates this dynamic sharply. On Monday, 23 March, the day of the US restraint announcement, net inflows reached $167.2 million. The move was driven predominantly by IBIT, which absorbed $160.8 million, marking its strongest single-day inflow since 17 March and halting a three-day post-Federal Open Market Committee (FOMC) outflow streak.
That momentum partially reversed on Tuesday, 24 March, with $66.6 million in net outflows coinciding with Iran’s denial. Even so, the week-to-date net position remains positive at $100.6 million. These flows make one thing plain: ETF allocators aren’t running complex macro models. They’re reacting with immediate precision to the geopolitical news flow from the Iran theatre.
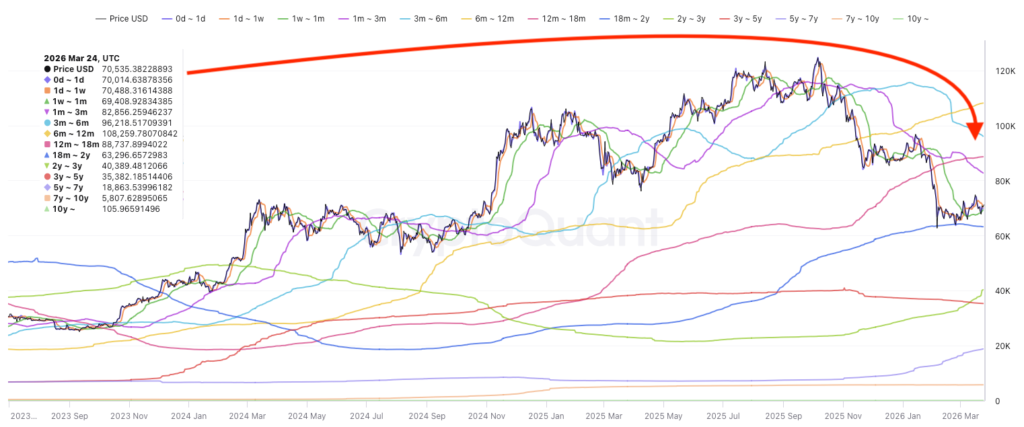
The structural question this raises for the air gap is the same one identified last week: follow-through demand. As established via the Unspent Transaction Output (UTXO) Realised Price Distribution, the $72,000–$82,000 band carries thin historical cost-basis accumulation. Limited supply was transacted there, meaning limited technical resistance if acceptance is achieved.
The pre-condition for that acceptance hasn’t changed: sustained ETF inflows and continued spot buying. What has changed is that the primary macro obstacle to those inflows, Brent above $112 and rate-hike pricing at 40 percent, has materially softened in 48 hours on a single geopolitical statement. Oil at $102 is a different environment to oil at $112. The rate-hike narrative doesn’t survive an energy reversal, and markets know it.
Whether Monday’s IBIT-led recovery was a one-session relief trade or the opening of a renewed accumulation regime will be visible in the next two to three days of flow data. If inflows sustain above $100 million per day through the end of the week, consistent with the pre-FOMC pattern, the demand pre-condition for air gap acceptance will have been re-established. If Tuesday’s partial reversal deepens, the market will have confirmed its treating Trump’s pause as a temporary signal rather than a durable shift, and bitcoin reverts to the prior consolidation range, with $67,035 as the live floor.
Takeaway
- The $72,000–$82,000 air gap is structurally intact and now directly in play, with acceptance above the bottom band confirmed.
- Trump’s de-escalation signal repriced the probability distribution faster than any macro data could.
- ETF flows confirm institutional allocators are reading the geopolitical tape same-day.
- The bull trigger identified last week, Iran de-escalation leading to oil below $100 and a rate-hike reversal, has begun activating. Whether it sustains is a function of the next 48–72 hours of flow data.


Be the first to comment