



PEPE is forming a falling wedge as buyers defend support, signaling a potential bullish recovery. Momentum indicators remain positive, with MACD supporting upside pressure, while RSI shows strong but overheated momentum. A confirmed breakout could strengthen the bullish outlook and attract renewed buying interest.
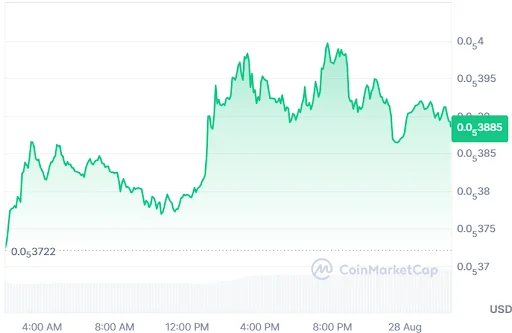
At the time of writing, PEPE is trading at $0.000003885 with a 24-hour trading volume of $440.59 million and a market capitalization of $1.6 billion. Following the 2.85% gain over the last 24 hours, the PEPE price structure and improving technicals point to a bullish reversal ahead.
Source: CoinMarketCap
Also Read: PEPE Price Analysis: Falling Wedge Breakout Sparks Hope for $0.00000550

PEPE Eyes $0.0000050 Breakout as Falling Wedge Forms
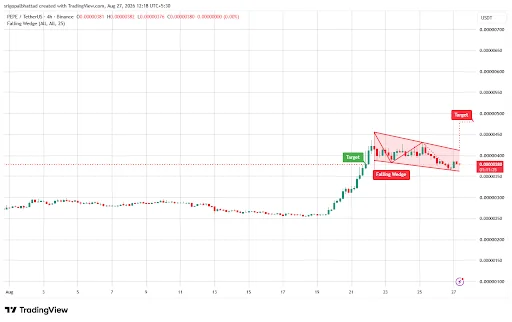
However, the crypto analyst Crypto With Gopal highlighted that PEPE is consolidating within a falling wedge after a sharp breakout, with the pattern suggesting selling pressure may be gradually weakening.
The $0.0000037 support zone remains crucial as buyers continue defending lower levels. If PEPE maintains this support while the wedge narrows, the setup could strengthen and position the token for another potential upside move.
Source: Crypto With Gopal’s X Post
Breaking out above the upper resistance level of the wedge formation may revive bullish sentiment and may have $0.0000050 as the price target for the next move.
Any increase in trading activity will be bullish for the breakout, whereas failing to support $0.0000037 will invalidate the bullish bias. Currently, the PEPE buyers are cautiously bullish and await further developments.
Momentum Indicators Support Upward Recovery
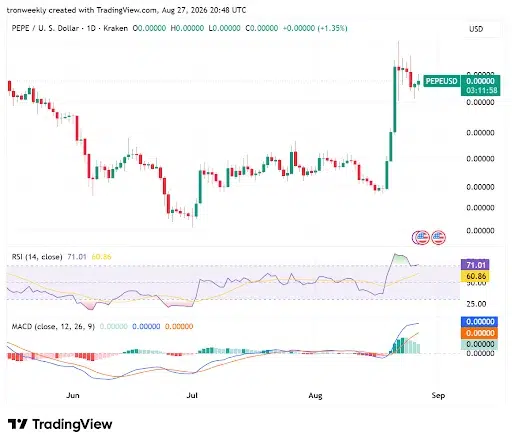
According to TradingView, RSI (14) is at 71.01, above the 70 level, representing the overbought area, with its moving average close to 60.86.
It shows positive momentum and growing buy pressures, though PEPE is heading towards an overbought territory. The current rally in RSI proves positive momentum, though a small decline from the high indicates a slowdown soon.
Source: TradingView
MACD is still strongly bullish, as the MACD line is higher than the signal line, while the histogram is above zero. The strong increase of the indicator after the change in momentum supports the fact that upward pressure is increasing.
However, the histogram has started to contract a little bit, which means that the acceleration of the bullish momentum has slowed down.
What Happens Next?
The next direction for PEPE will depend on how buyers are able to break through resistance from the falling wedge pattern.
A successful breakout accompanied by increased volumes will add bullish strength and bring in new buyers into the market. On the other hand, failure to overcome resistance is likely to result in consolidation and more selling activity.
Also Read: PEPE Price at a Crossroads: Breakout or Another Major Selloff Ahead?
This article contains market analysis and price predictions. These are not guarantees. Crypto markets are volatile. Always DYOR. Not financial advice.


Be the first to comment