



After its explosive August breakout, XRP is trying to create an entirely new market structure, but the most recent candles indicate that the initial phase of the rally has already cooled. After briefly hitting about $1.70 during the first breakout, XRP is currently trading close to $1.42. The technical picture as a whole is still much stronger than it was earlier in August, despite the significant rejection from that local high.
XRP crosses multiple thresholds
Most significantly, XRP is still trading above the daily chart’s four major moving averages. The 200-day moving average is especially significant; it is currently at $1.35. Since XRP spent the majority of 2026 below this indicator, its recent rise above it is a significant technical shift.
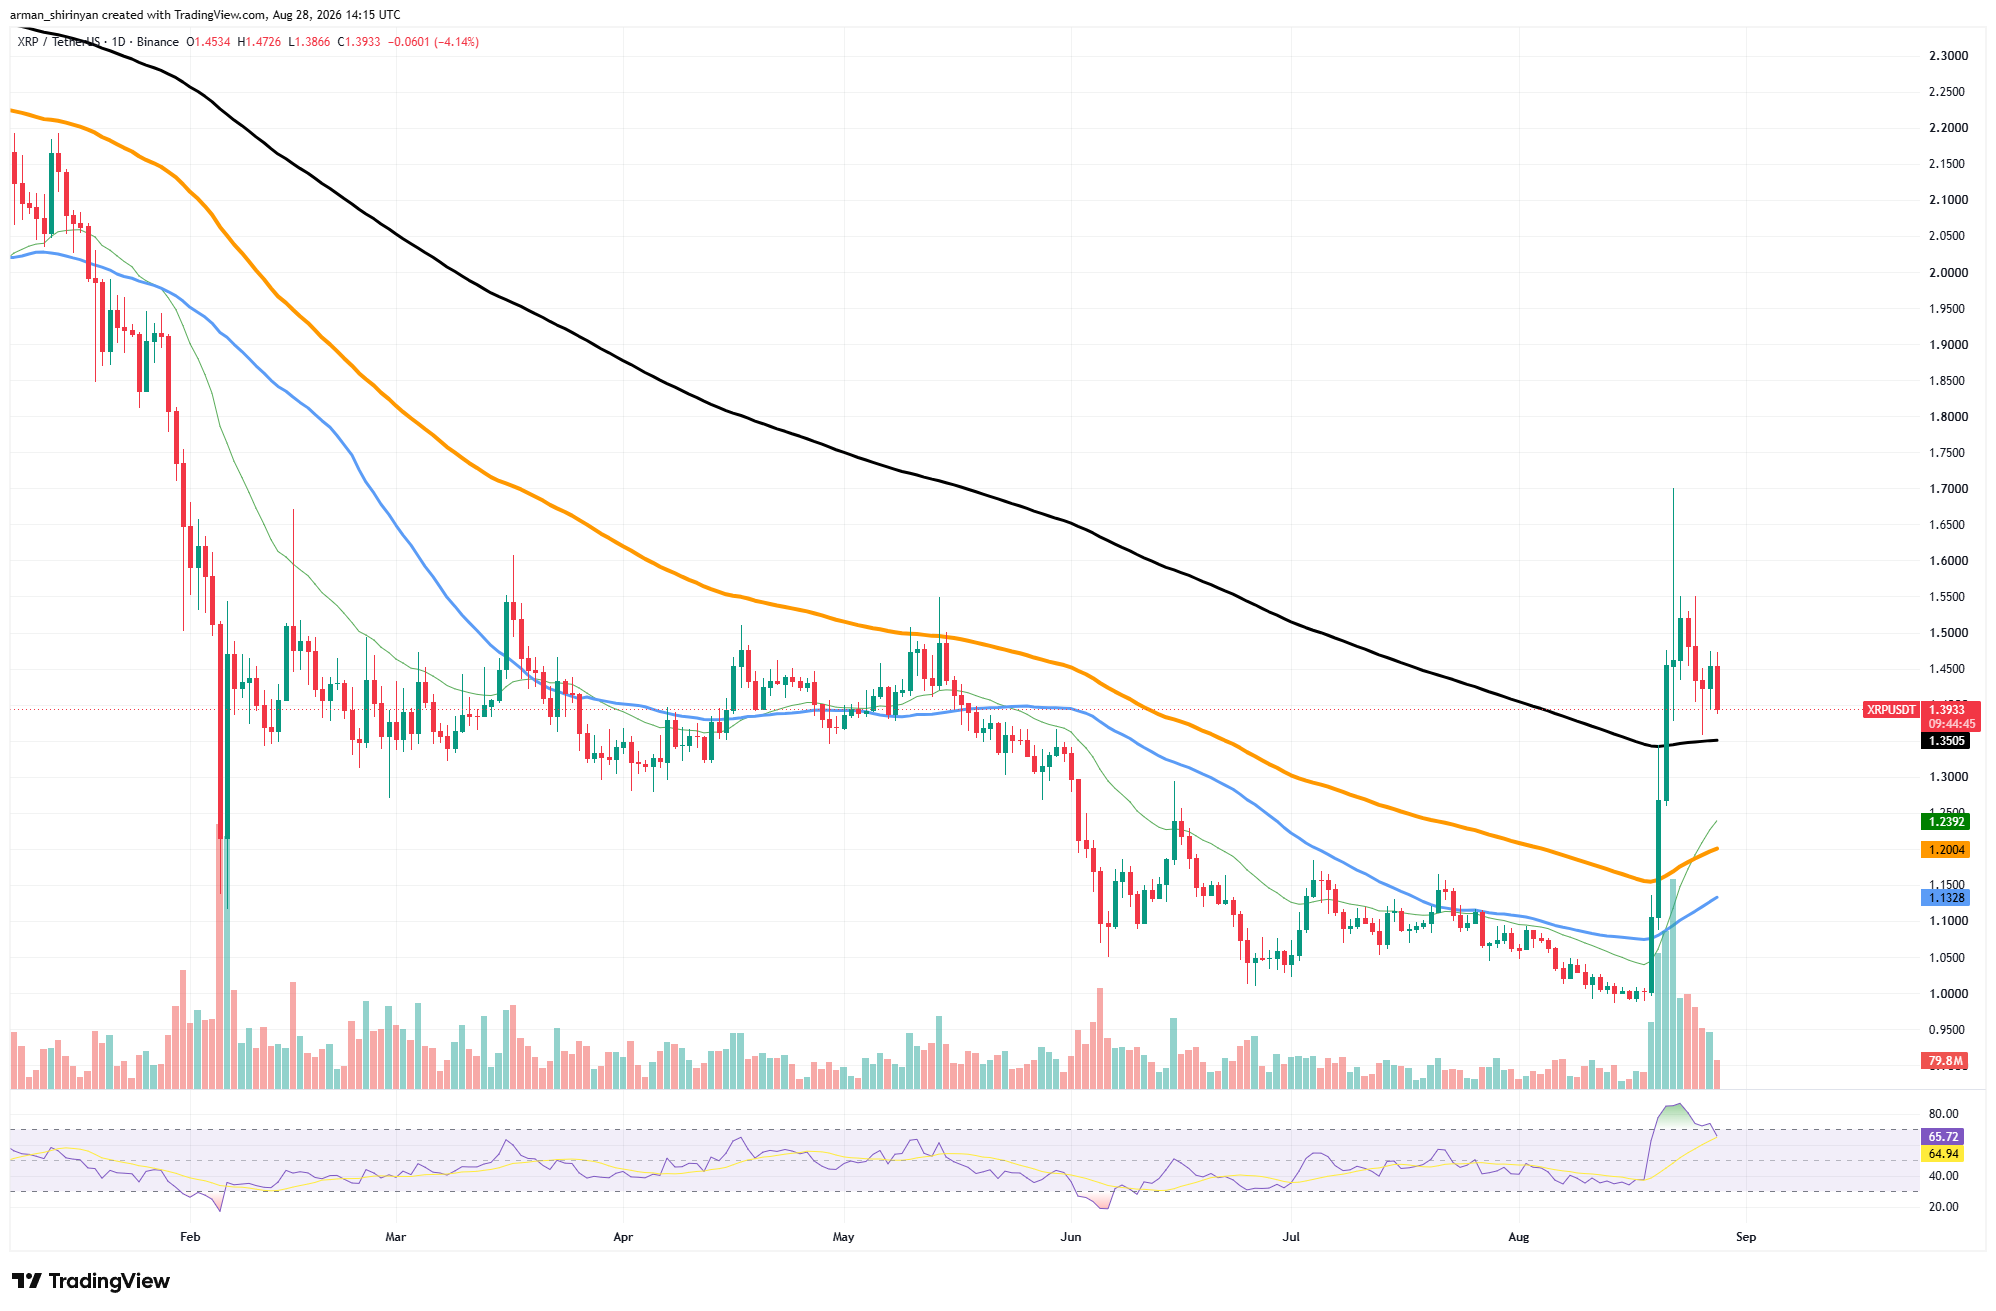
The breakout structure does not change into another transient price spike as long as XRP stays in the $1.35–$1.40 range. Shorter moving averages offer much less support. The 50-day and 100-day averages are roughly $1.20 and $1.13, respectively, while the 20-day EMA is close to $1.24. After the quick rally, XRP is now somewhat extended, so further consolidation would not necessarily harm the bullish setup. Volume bolsters the move’s importance as well.

You Might Also Like

The breakout coincided with one of the biggest volume expansions the chart had seen in months. But as XRP entered consolidation, volume subsequently decreased, indicating that the initial surge of aggressive buying has abated. After recently rising above 80, RSI is still high at about 69.
Although the pullback from overbought territory is positive, it also suggests that momentum is returning to normal. The immediate resistance on the upside is $1.50. The route toward $1.60 and the most recent $1.70 peak could be reopened by a daily close above that level. However, another vertical rally is not necessarily required for XRP.
Long way for SHIB
Unlike XRP, Shiba Inu has not yet completed the most significant portion of its technical reversal, despite having made significant progress since its August lows. After a strong move toward $0.00000620, SHIB is currently trading at about $0.00000530. The 200-day moving average, which is close to $0.00000572, is still above the token despite the rally pushing it well above its short- and medium-term moving averages.
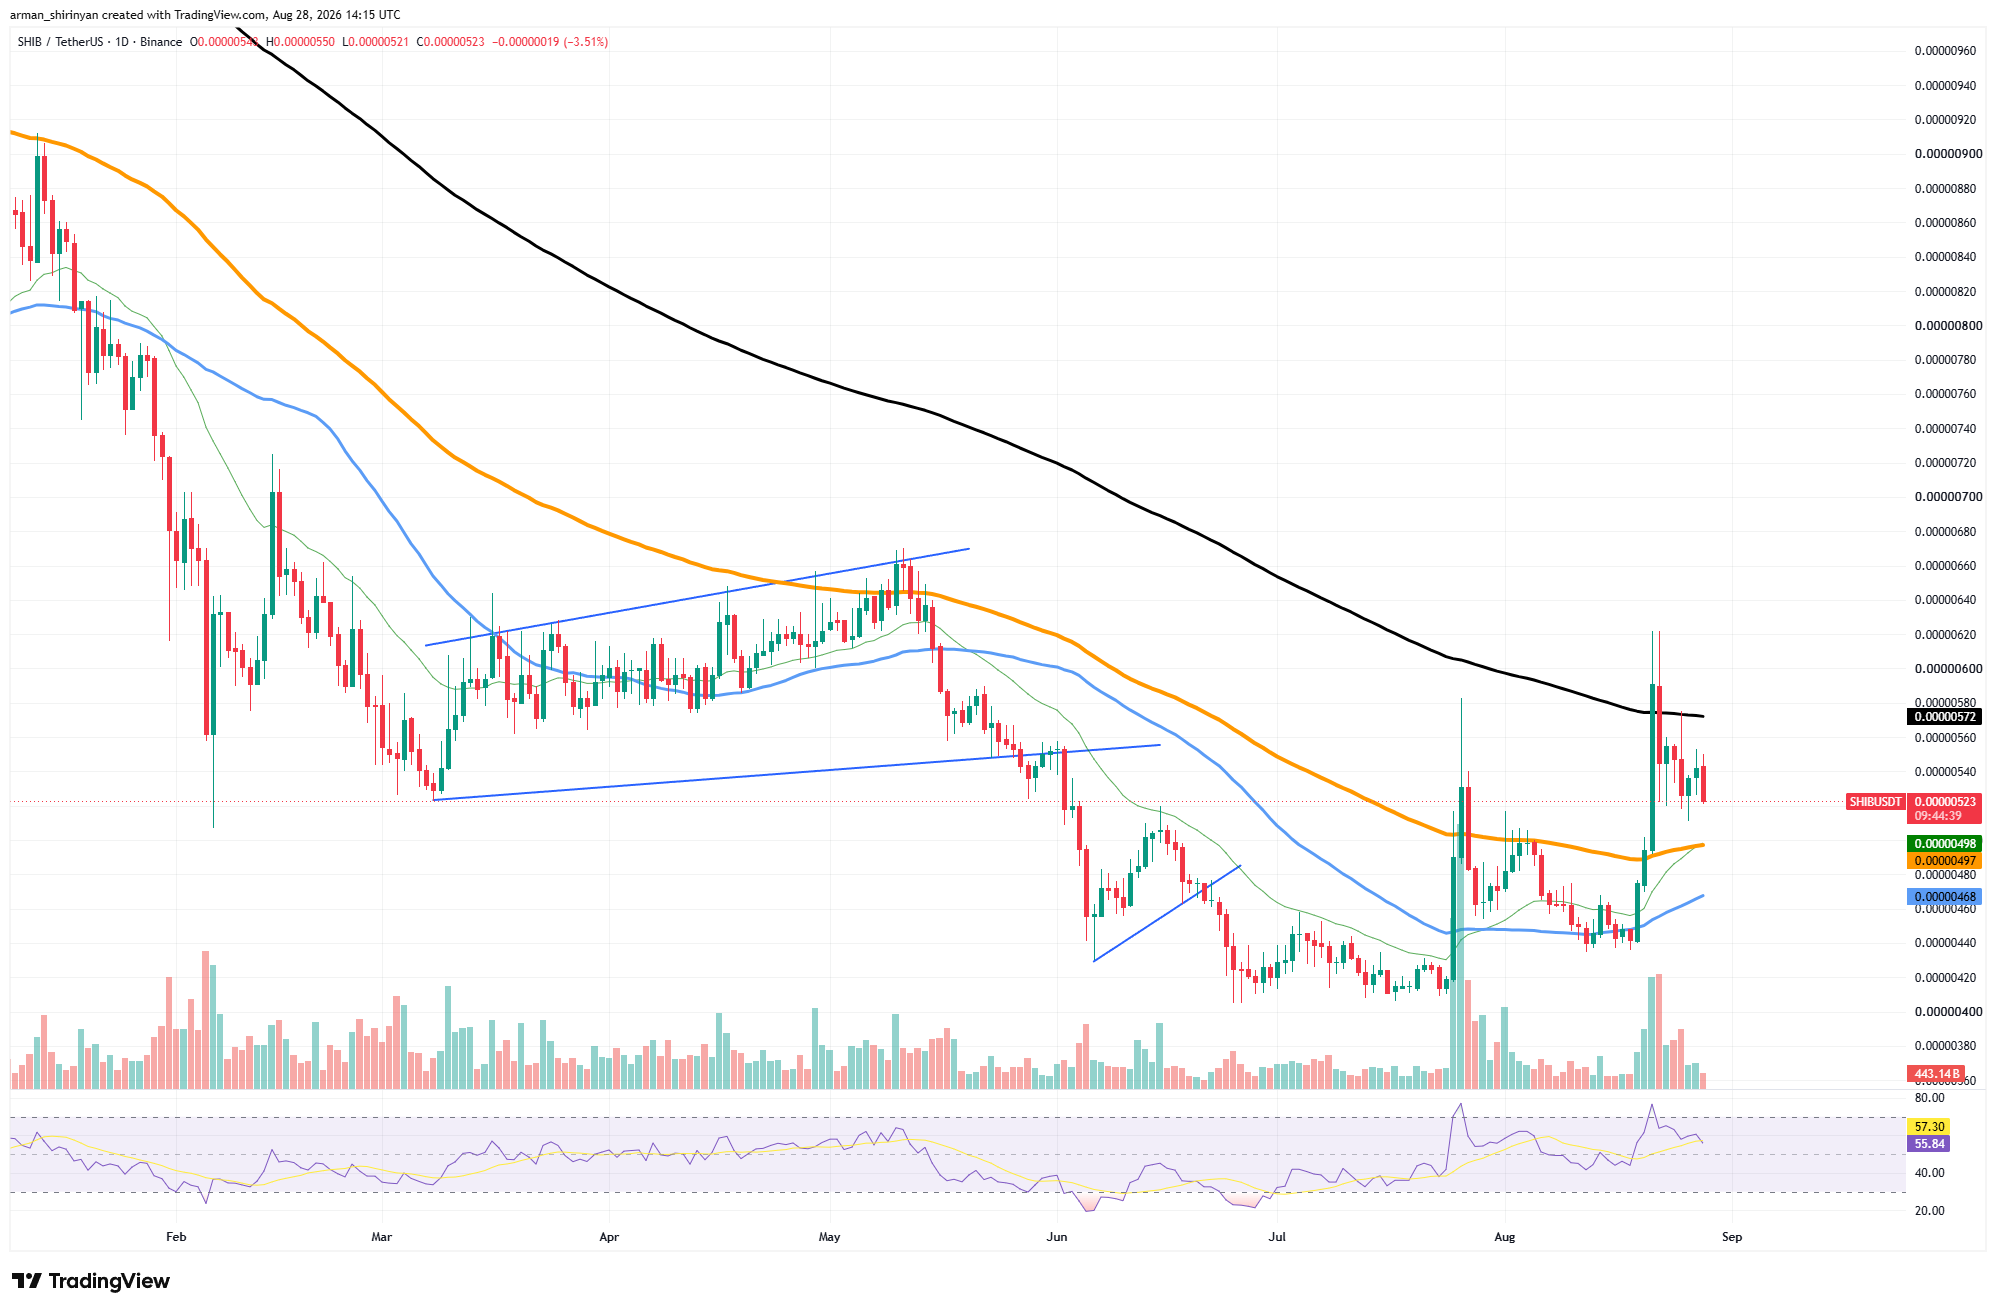
The main technical challenge is now at that level. The rejection around $0.00000600–$0.00000620 demonstrates the need for caution in the current situation. Although buyers were able to break through the previous August range and momentarily challenge the long-term trend indicator, they were unable to sustain the advance.
Since then, SHIB has consolidated around $0.00000530. However, the underlying structure has improved. The 50-day average is close to $0.00000468, the 100-day moving average is close to $0.00000497, and the 20-day EMA is close to $0.00000499. The token now has a significant support cluster around $0.00000470–$0.00000500, as SHIB is trading above all three.
You Might Also Like

Another positive signal comes from volume. Sharp increases in trading activity accompanied both of August’s major rallies, but the most recent decline was accompanied by a drop in volume. This lessens the threat of the retreat compared to a large-scale sell-off. Additionally, momentum has stabilized without collapsing.
After momentarily entering overbought territory during the breakout, the daily RSI is currently at 58. As a result, SHIB can make another upward attempt without immediately running into the same momentum extremes. The critical level remains between $0.00000572 and $0.00000600. The current recovery could become a wider trend reversal if the 200-day moving average is reclaimed and held, with $0.00000620 as the next obvious target.
Can Stellar maintain the recovery?
After an explosive comeback from the $0.155 area, Stellar is trying to maintain its most recent recovery, but XLM has reached the area of the chart where resistance becomes much harder to overcome. After briefly rising above $0.22 during the August rally, XLM is currently trading at about $0.184.
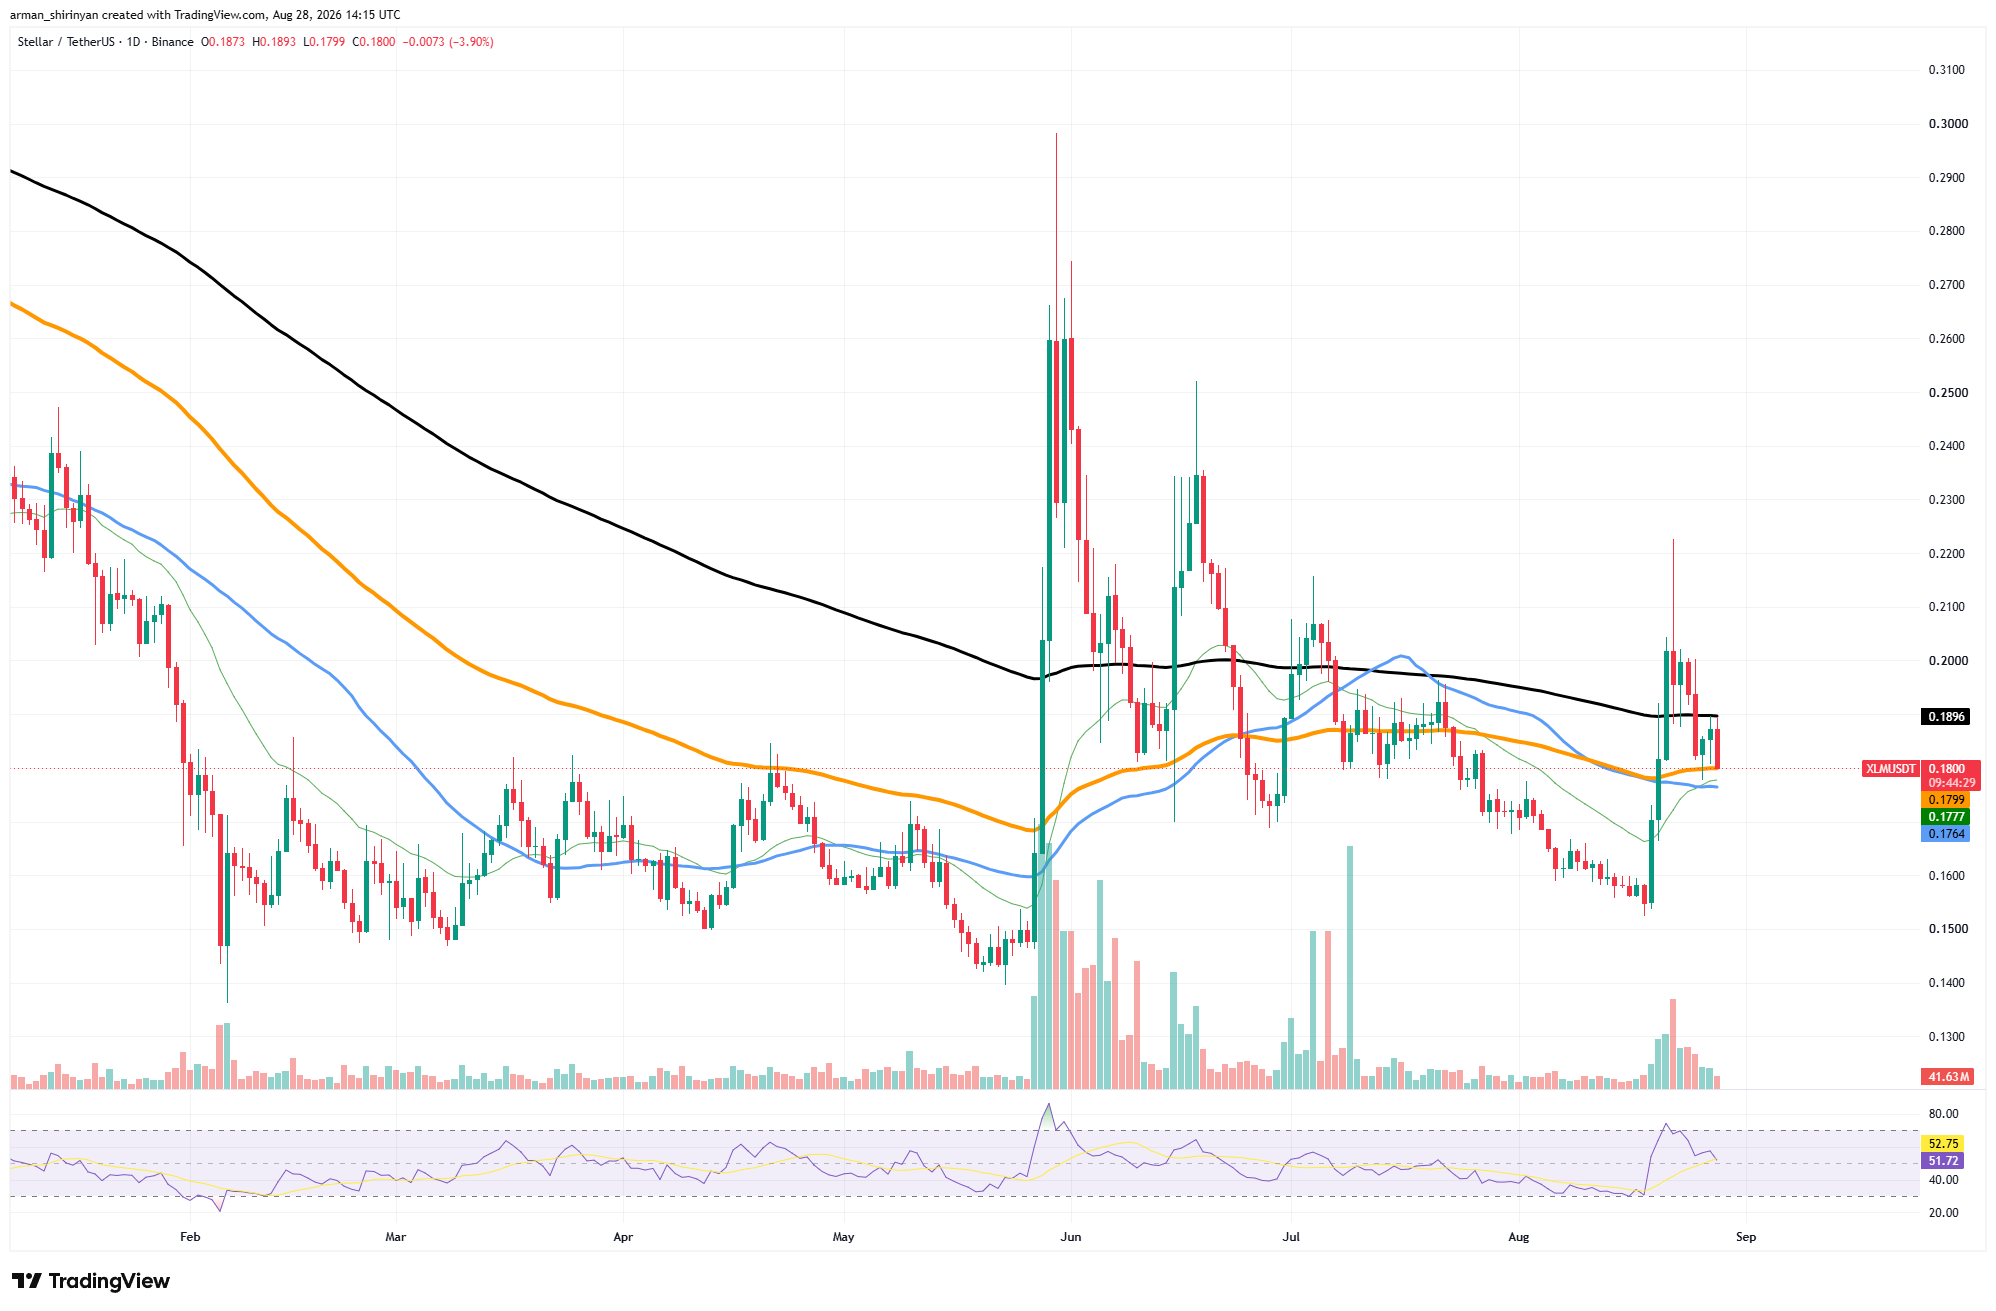
A significant portion of that spike was eliminated by the subsequent retracement, but buyers have so far kept the price from returning to its pre-breakout range. The 200-day moving average, which is currently at about $0.190, is the most immediate challenge.
You Might Also Like

During the rally, XLM momentarily crossed this indicator but was unable to establish support above it. Because of this rejection, the main resistance zone is the $0.190–$0.200 range. The structure would be greatly enhanced by a strong daily close above $0.20, which might also bring $0.22 back into focus.
However, XLM has established a useful concentration of support below the current price. The 20-day EMA and 50-day moving average are close to $0.178 and $0.177, respectively, while the 100-day moving average is located around $0.182. As a result, a comparatively dense support zone is formed between $0.176 and $0.182. Maintaining that cluster is crucial.
The current retracement may continue to be a consolidation after the breakout rather than the start of another decline if buyers defend it. Momentum has already decreased significantly. After rising above 70 during the rally, RSI has fallen toward 54, eliminating most of the short-term overheating. Since the initial breakout surge, trading volume has also decreased.
Bitcoin makes a key reversal
In just a few days, Bitcoin went from about $63,000 to almost $80,000, making one of its strongest technical moves in months. Although the breakout has significantly improved the structure of Bitcoin, momentum is still severely stretched as the market enters a crucial resistance zone.
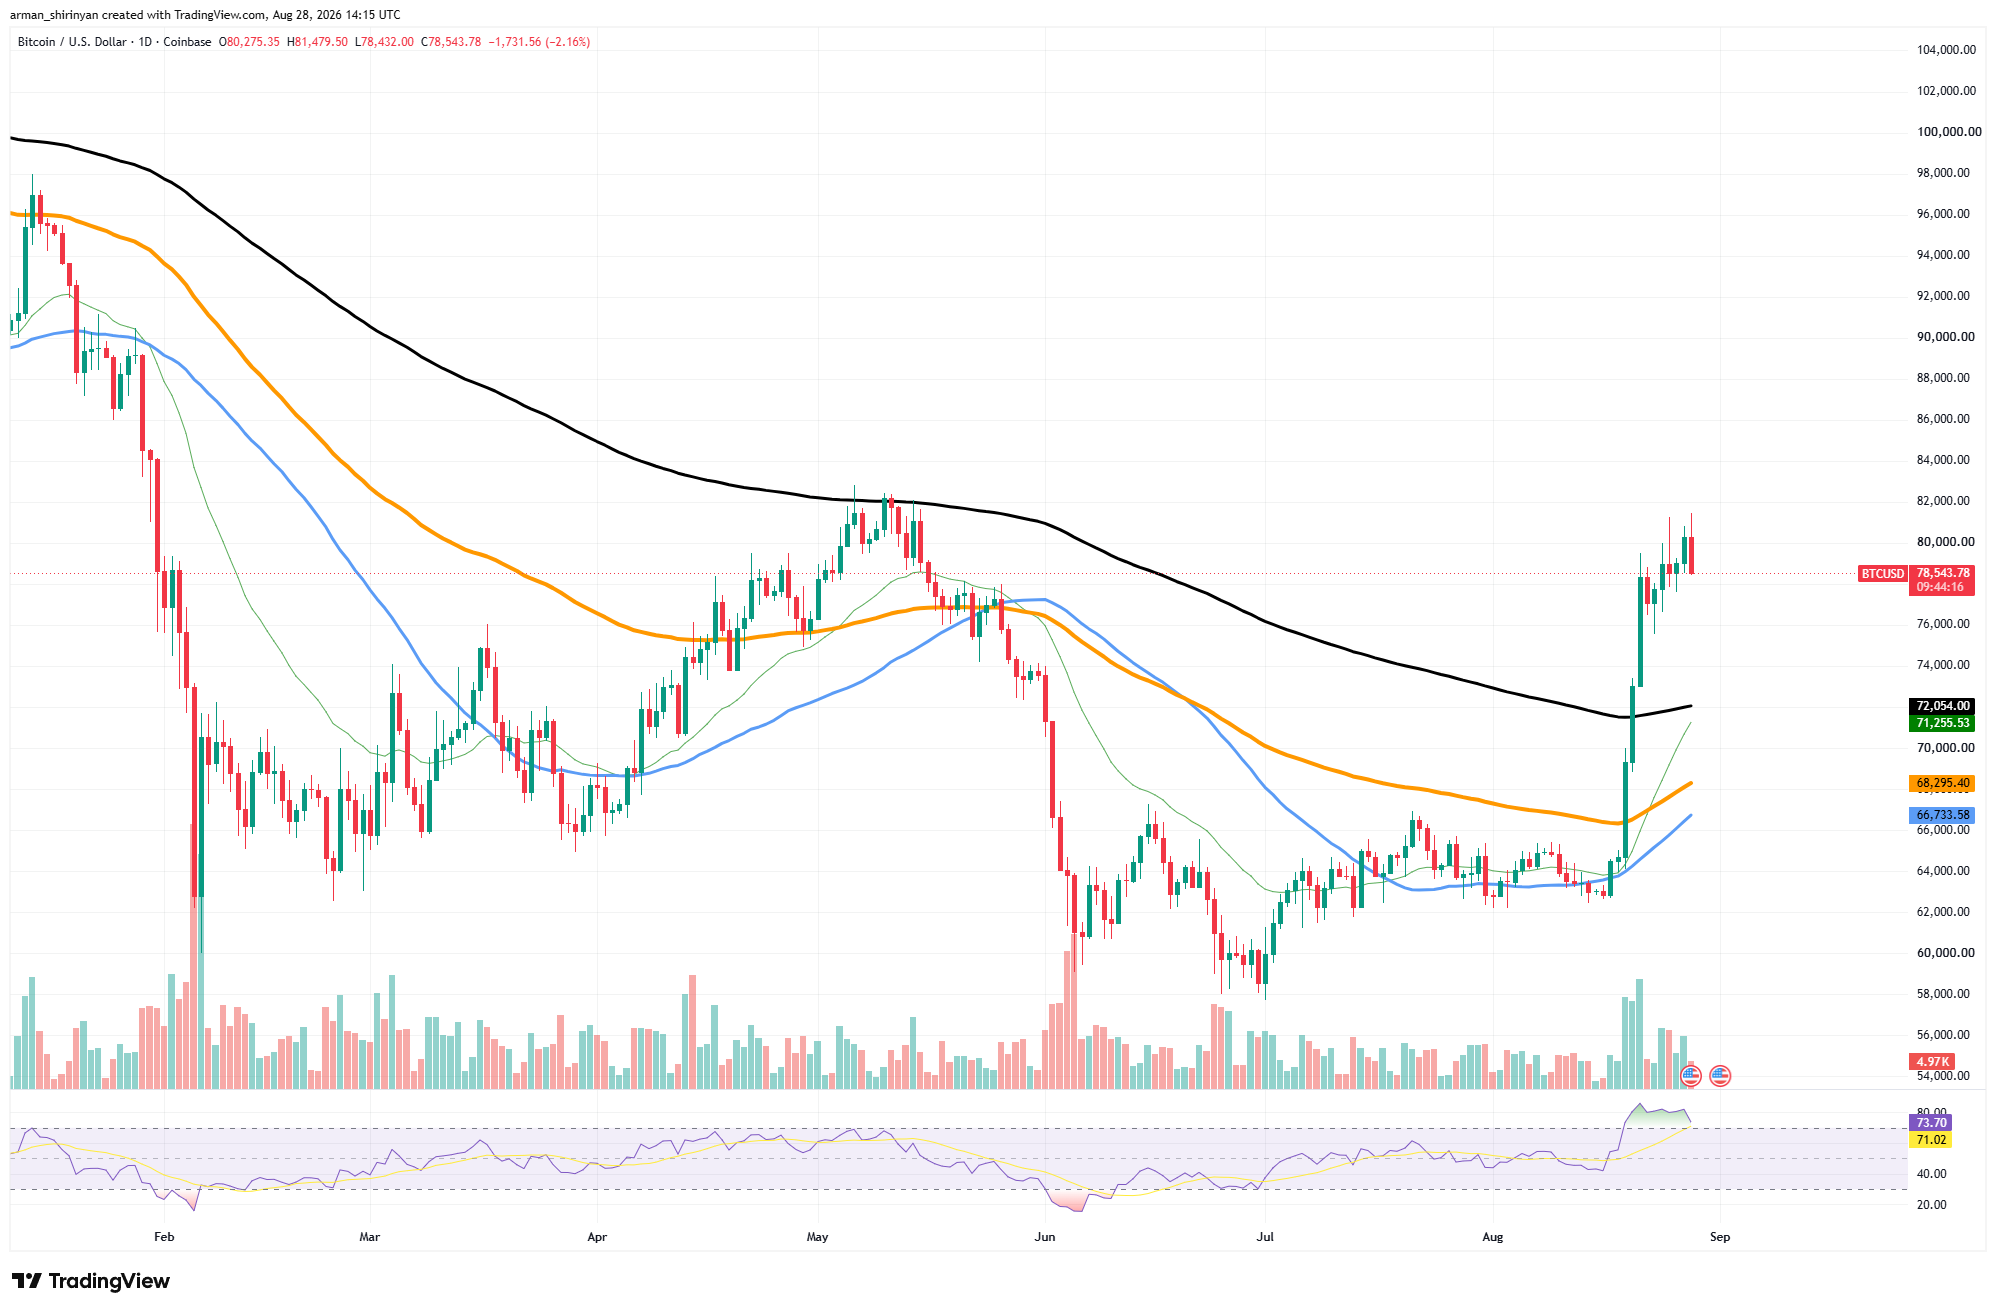
After briefly rising above $80,000, Bitcoin is currently trading around $79,360. The rally started with a clear breakout from the narrow range of $62,000 to $65,000 that dominated most of July and August. More significantly, during the advance, Bitcoin crossed all of the major moving averages displayed on the daily chart.
The most significant development is represented by the 200-day moving average close to $72,060. Since Bitcoin had been below this indicator for several months, the move through it represented a significant long-term technical improvement. The 50-day and 100-day moving averages are still at roughly $68,300 and $66,750, respectively, while the 20-day EMA has also accelerated toward $71,300.
You Might Also Like

Although the gap between the spot price and those averages also shows how quickly BTC has moved, this arrangement provides Bitcoin with a significant support structure below its current price. RSI confirms that concern. Right now, the indicator is firmly in overbought territory, at about 77.
The current resistance zone is between $80,000 and $82,000. This region has already begun to produce resistance and coincides with Bitcoin’s May local peak.
One of the biggest technical obstacles still standing would be removed by a clear breakout above $82,000, which could lead to much greater upside. The first area to watch is $76,000–$77,000 if Bitcoin fails there.
A deeper correction toward $72,000 would represent a more significant retest of the recently recovered 200-day average. Bitcoin’s structure is now clearly stronger, but after an advance of about $17,000, either a clean breakout supported by fresh volume or consolidation below $82,000 will likely be necessary for further gains.



Be the first to comment