


What to know:
- Bitcoin shows cautious movement despite slight gains, with weak momentum indicators limiting bullish confidence.
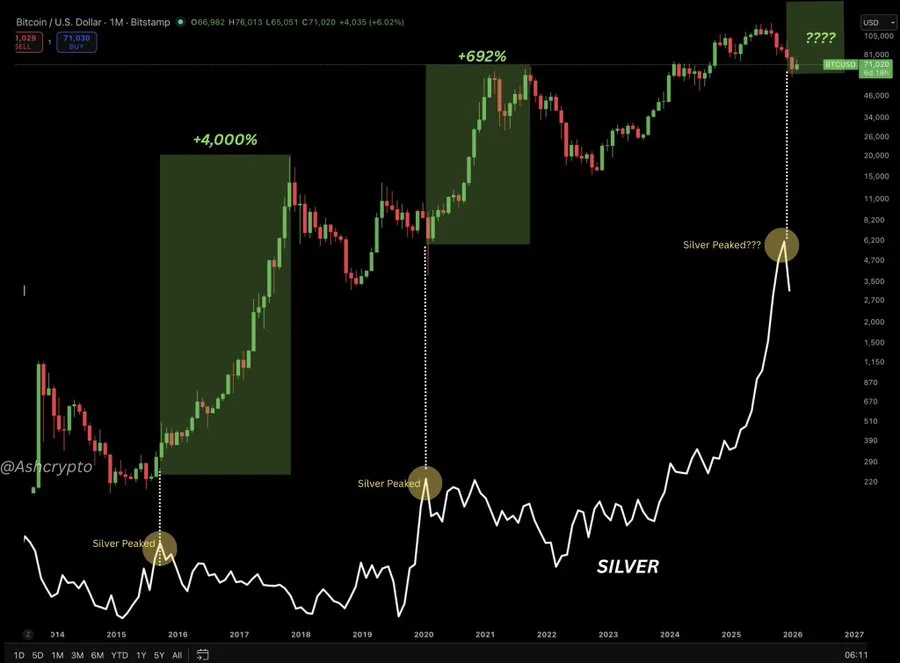
- Historical silver price peaks have previously preceded major Bitcoin rallies, raising 2026 expectations
- Current RSI and MACD signals indicate low buying pressure and continued downside risk.


Bitcoin is showing early signs of cautious movement as investors look at possible market indicators related to historical trends of the silver price. Analysts have noted that past trends of a peak in the silver price have indicated a major run-up in Bitcoin, and this could potentially happen again in 2026.
At the time of writing, Bitcoin is trading at $70,851. Its 24-hour trading volume is $37.98 billion, and its market capitalization is $1.42 trillion. Although its price has increased by 1.62% over the last 24 hours, technical indicators suggest that momentum is still limited.


Source: CoinMarketCap
Bitcoin Watches Silver Rally Signal
On March 25, 2026, a popular crypto analyst, Ash Crypto, pointed out the historical relationship between silver and Bitcoin, which is now gaining more attention from traders. In the past, silver saw an all-time high in 2016; subsequently, Bitcoin saw an all-time high of $19,000 in 2017.

Source: Ash Crypto’s X Post
However, a similar phenomenon was witnessed in 2020 when silver topped before the rise of Bitcoin to $69,000 in 2021. With silver now trading at around $121, investors are asking whether the same phenomenon may be witnessed for Bitcoin.
Bitcoin Faces Pressure Below Key Levels
Despite this optimism, current technical indicators point to ongoing pressure. The Relative Strength Index (RSI) is currently at 36.73, which is lower than the 50 mark.
This implies that there is low buying pressure for Bitcoin. Bitcoin’s price is also currently holding below critical moving average levels of $80,799, $87,500, and $98,087, which indicates a continued downtrend. Key support is also at $59,271.
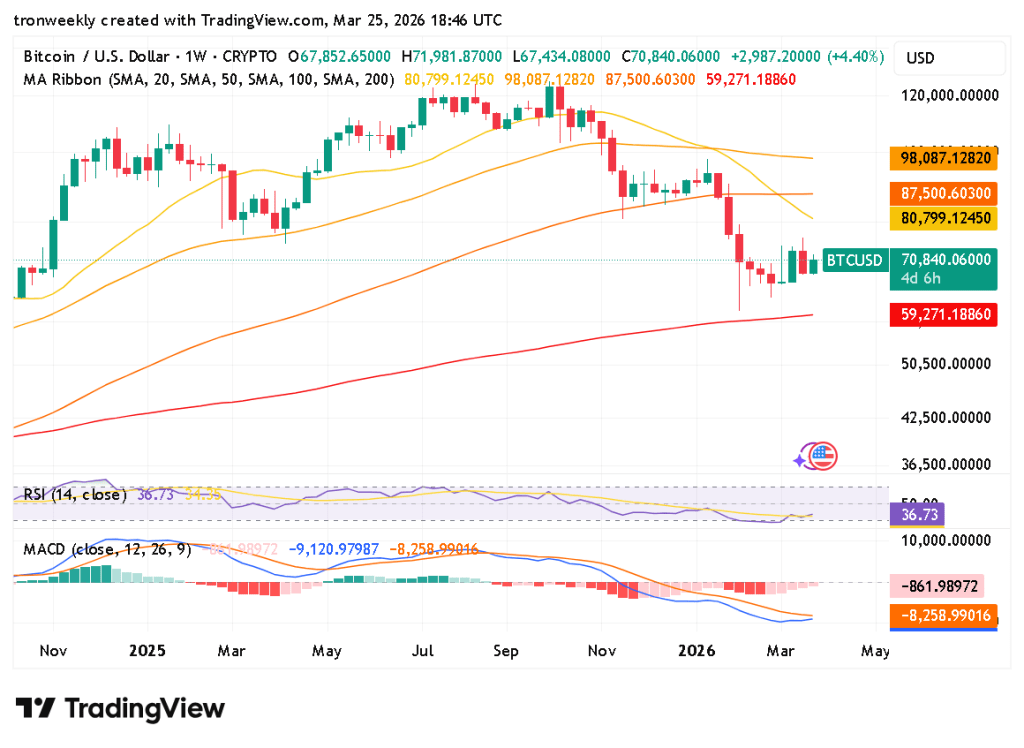
Source: TradingView
This is supported by the momentum indicators, which also point towards a conservative view. The MACD indicator is negative, with the MACD line being at -9,120, which is lower than the signal line, which is at -8,258. The histogram is also negative, being at -861.
Also Read | Circle’s USDC Freeze in 2026 Sparks Debate on Centralized Control
Bitcoin Stability in Question Amid Silver Trends
Overall, although historical data related to Silver indicates a sense of optimism, the current price action of Bitcoin indicates it is still searching for stability. Investors are paying attention to whether historical trends will resume or if things will take a different turn this year.
This article contains market analysis and price predictions. These are not guarantees. Crypto markets are volatile. Always DYOR. Not financial advice.
Also Read | Dogecoin Eyes $0.112 Rally: Can Bulls Flip $0.10 Into Support?

Be the first to comment