


Ripple’s XRP is undergoing a corrective phase after its explosive breakout from the $1 region. While the broader structure has improved substantially, fading momentum below the $1.45-$1.55 resistance zone suggests the market may need a deeper pullback or additional consolidation before attempting another sustained advance.
XRP Price Analysis: The Daily Chart
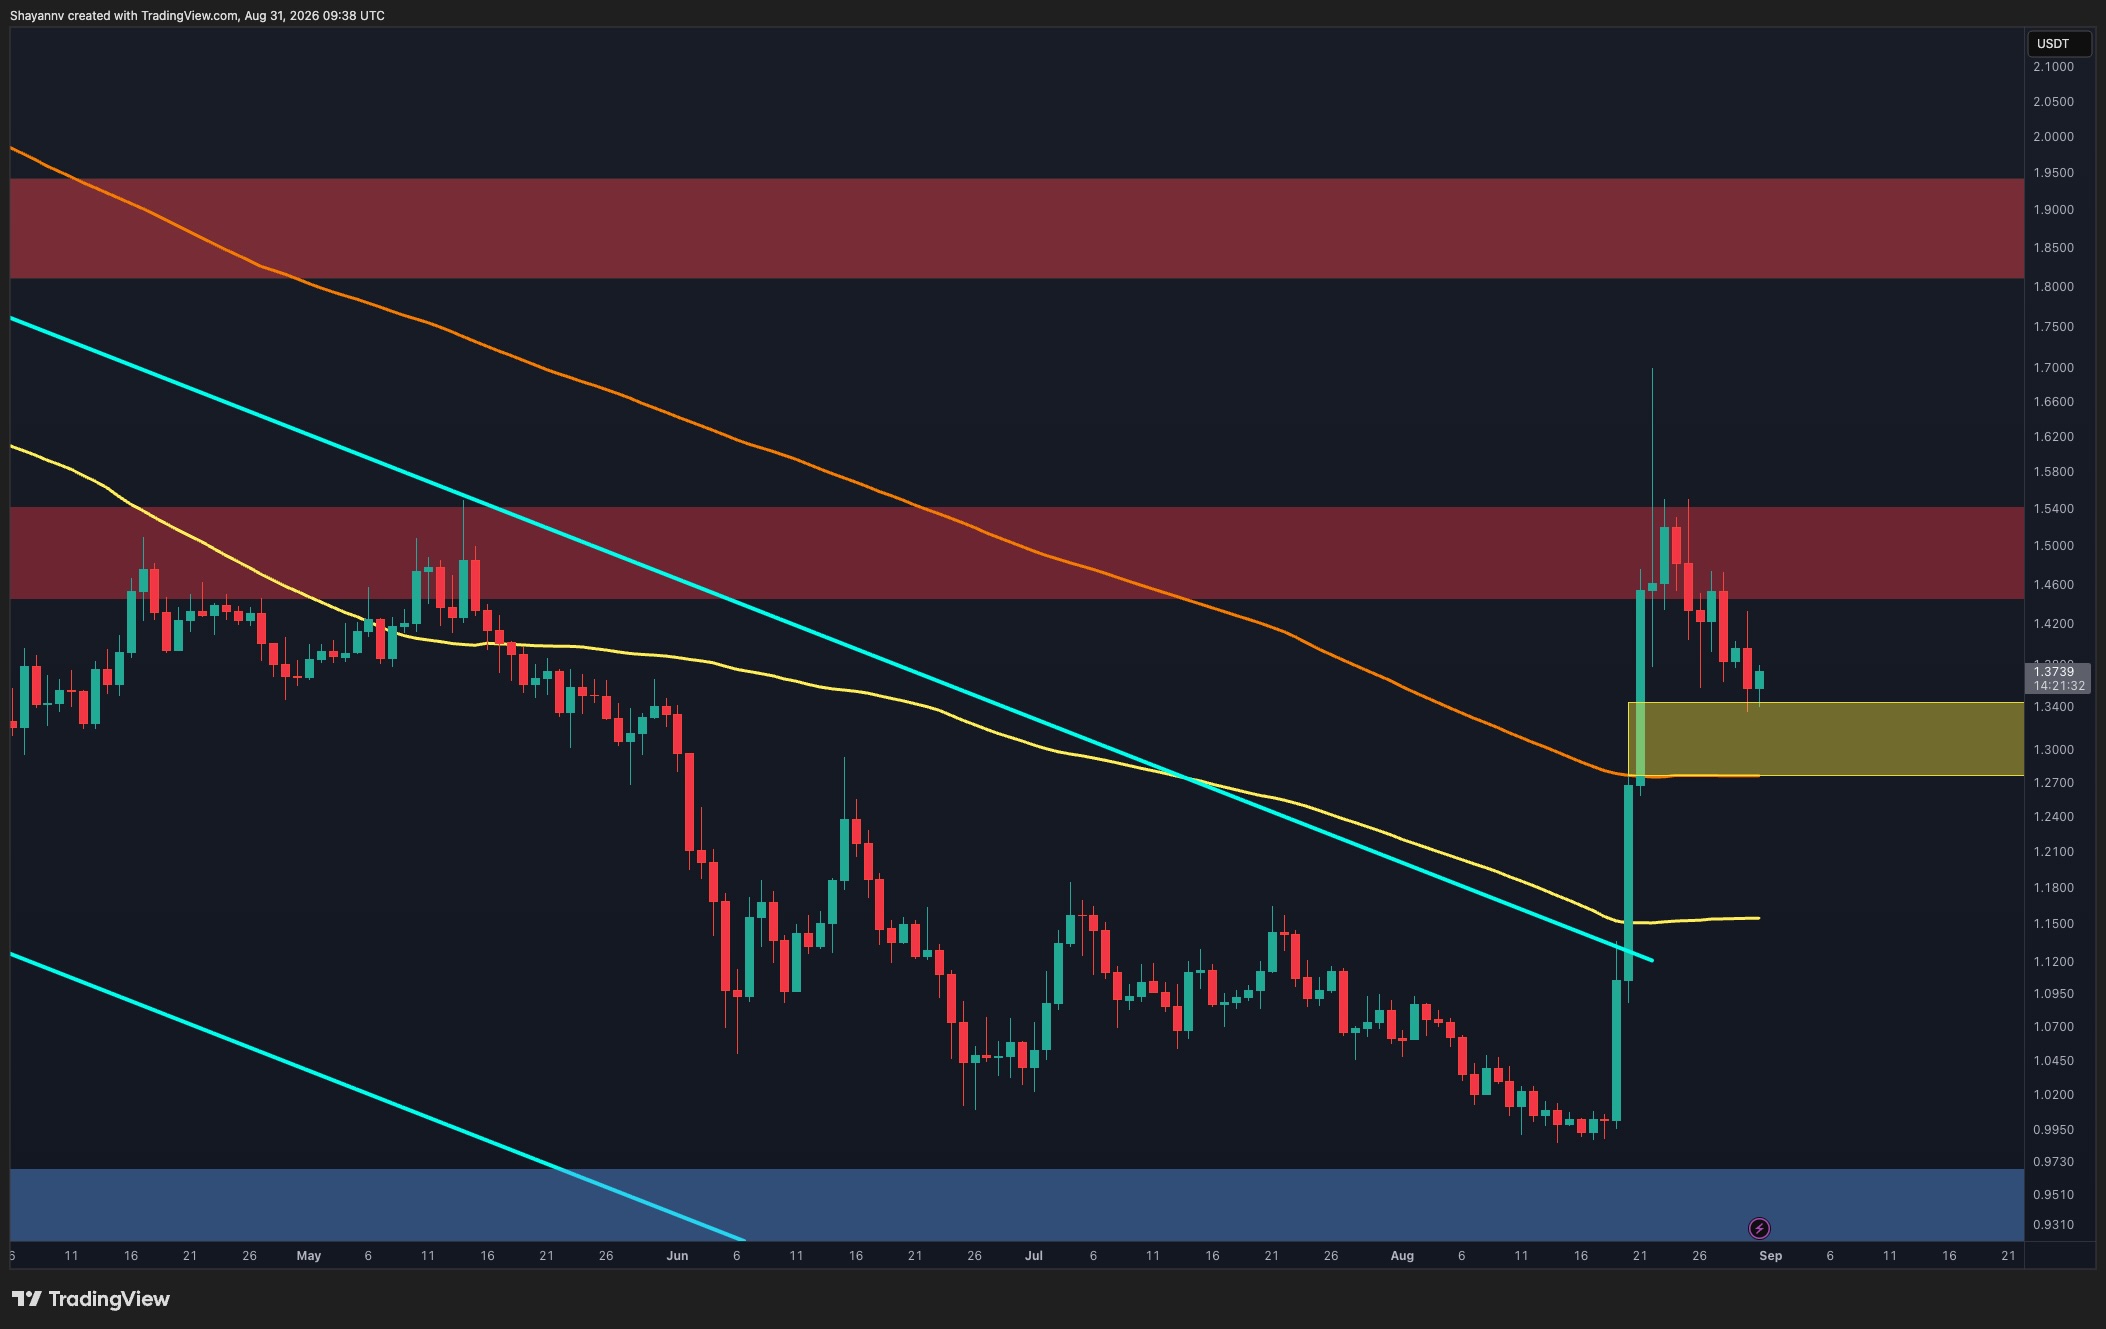
On the daily timeframe, XRP’s breakout represented a major structural shift, with the price escaping the prolonged descending channel and surging through both moving averages. However, the rally encountered substantial selling pressure inside the $1.45-$1.55 resistance zone, while the long upper wick toward $1.70 highlights the rejection of higher prices.
The token has since retraced toward $1.37, with the sequence of lower highs and lower lows following the rejection indicating that short-term momentum has turned corrective.
The first important support is the $1.27-$1.34 zone. This area also overlaps with the higher moving average shown on the chart, strengthening its technical significance. A successful reaction from this region could allow XRP to stabilize before another attempt at the $1.45-$1.55 resistance zone.
However, a daily breakdown below $1.27 would weaken the post-breakout structure and increase the probability of a deeper correction. In that case, the lower moving average around $1.15 could become relevant before the broader $0.93-$0.97 demand zone comes back into consideration.
XRP/USDT 4-Hour Chart
The 4-hour chart shows XRP consolidating after the initial rally from approximately $0.99 to $1.70. The subsequent rejection from the $1.43-$1.55 supply zone has gradually pushed the price back toward the 0.5 Fibonacci retracement at $1.34.
This makes the $1.33-$1.34 area an important near-term decision point. The asset has already tested this level and produced a modest reaction, but buyers have yet to generate a convincing recovery. Holding above it could lead to continued sideways consolidation and potentially another attempt at the $1.43-$1.55 resistance zone.
If the $1.34 level fails, however, the correction could extend toward the next Fibonacci levels. The 0.618 retracement at $1.26 sits inside the first notable pullback zone, while the 0.702 level near $1.20 provides another support reference. A more substantial correction would bring the 0.786 retracement at $1.14 and the broader $1.09-$1.14 support zone into focus.
For now, the short-term structure remains corrective below $1.43-$1.55. A sustained reclaim of this resistance zone would be needed to shift momentum decisively back toward the bulls and reopen the possibility of challenging the $1.70 high.

Disclaimer: Information found on CryptoPotato is those of writers quoted. It does not represent the opinions of CryptoPotato on whether to buy, sell, or hold any investments. You are advised to conduct your own research before making any investment decisions. Use provided information at your own risk. See Disclaimer for more information.




Be the first to comment