



HBAR price has been demonstrating some signs of recovery potential as the digital currency moves around a critical technical region that will decide its next move.
At the time of writing, HBAR is trading at $0.07493, up 0.93% over the last 24 hours, with a market capitalization of approximately $3.29 billion and daily trading volume of $67.44 million.
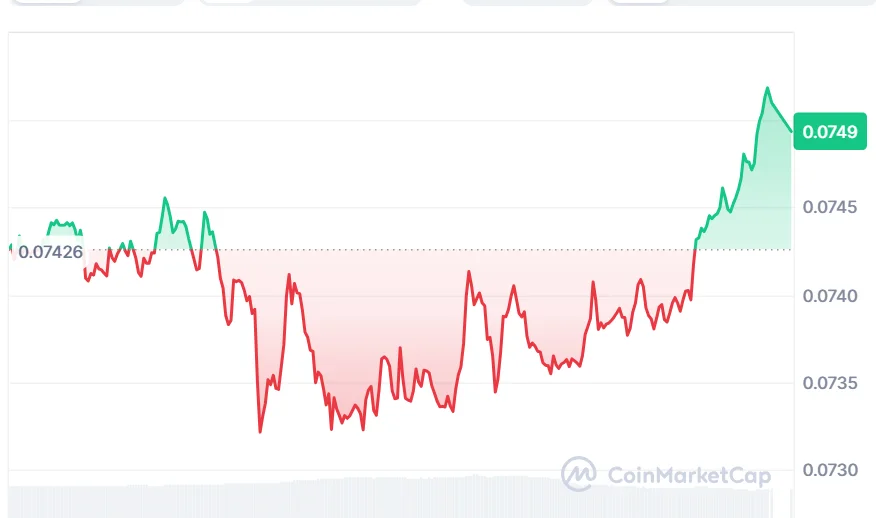
HBAR Price Signals Major Trend Reversal
On September 1, crypto analyst Crypto Patel signaled a possible HBAR price breakout in anticipation of a possible trend reversal, noting the location of the token within the accumulation zone below the descending trendline over several months.
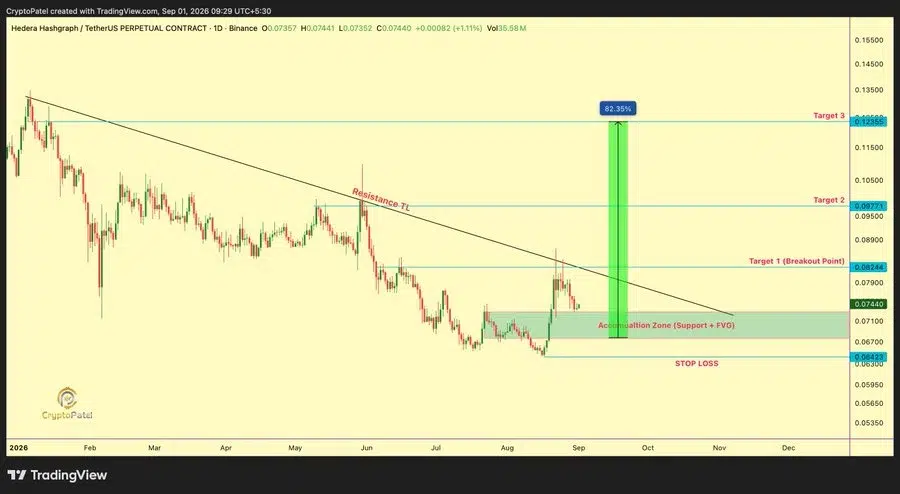
According to Patel’s opinion, the cryptocurrency is now trading within a possible range of entry from $0.067 to $0.072. At that, the stop-loss level has been set at $0.06423, while the break-out level stands at $0.08244.

Also Read | Pudgy Penguins Price Eyes $0.01 After 46.6% August Gain
HBAR Needs a Daily Close Above $0.08244
According to Crypto Patel’s analysis, the bullish pattern will get much stronger when HBAR closes the day above $0.08244. It will indicate that there is a chance that the previous downtrend could be weakening.
In case this breakout proves to be real, there are two targets to watch: $0.09771 and $0.12355. Achieving the latter from today’s price level is a significant rise for HBAR since it needs to overcome a few resistance levels first.
This structure allows investors to have a definite space to look for, whereas short-term holders might be more interested in seeing how the breakout from the $0.08244 level materializes instead of predicting its appearance.
The reason behind the need to make such a distinction is that HBAR is still trading below the long-term downtrend line.
HBAR Price Shows Bullish Setup
Other technical indicators also have HBAR in an important zone.
The HBAR price is now at $0.07493, a little above the Bollinger Bands mid-line, which is at $0.07318. The upper band is located around $0.08398, while the lower band is at $0.06238.
In this case, the upper Bollinger Band is close to the breakout zone of Crypto Patel at $0.08244. Hence, a break towards the upper band will be the first technical test for HBAR.
Remaining above the mid-level would sustain the positive short-term configuration. However, failure to hold this level may trigger further selling and push the token to retrace back to the lower side of the recent trading range.
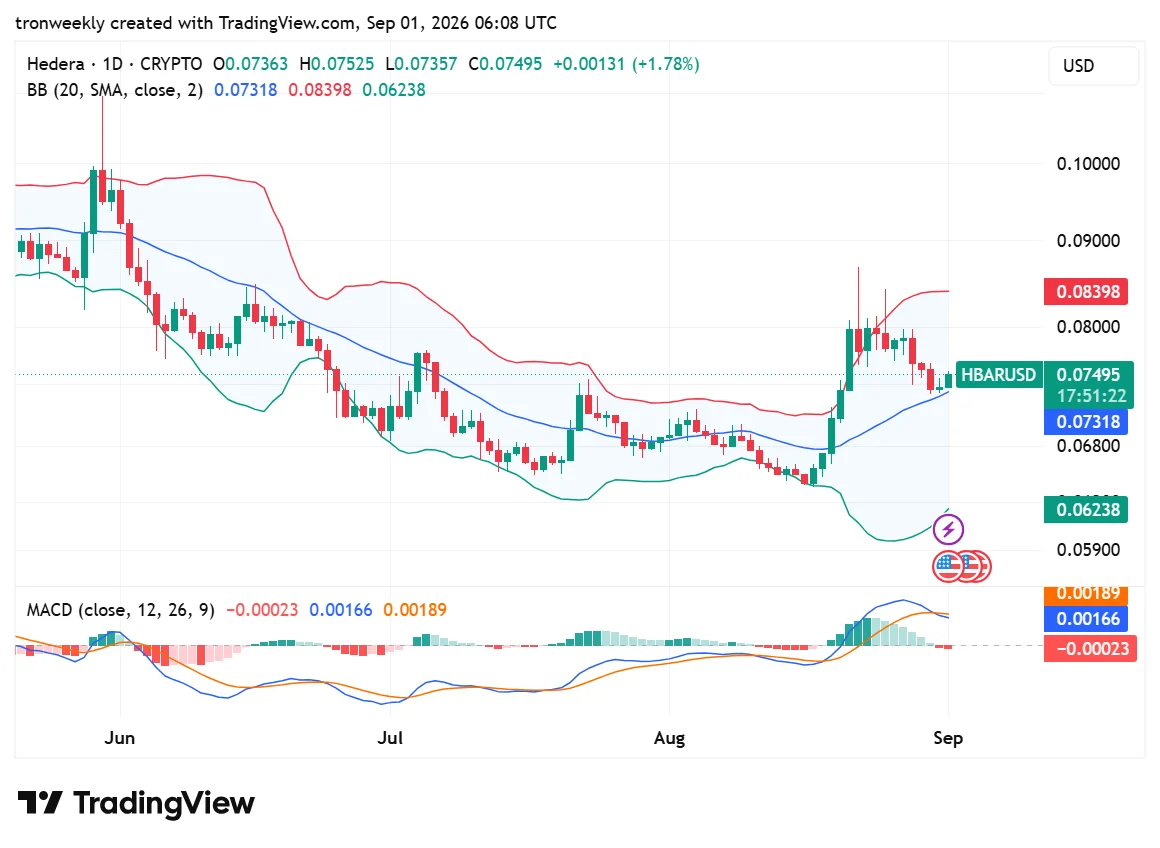
Meanwhile, the MACD paints a somewhat bearish view. The MACD line is currently at 0.00166, below the signal line at 0.00189, with the histogram around -0.00023, which indicates that the uptrend has become less strong after the recent rebound of HBAR.
A bullish crossover of the MACD would support the case of an advance towards the $0.08244 mark.
What Happens Next for HBAR?
HBAR is required to retain $0.07318 to continue its uptrend. A close above $0.08244 will expose HBAR to $0.09771 and $0.12355 levels.
Failure to rise above resistance levels will take HBAR towards $0.067 – $0.072, whereas breaking below $0.06423 will make the setup invalid.
Until now, there has been no indication of a trend reversal. It is required that HBAR stay above $0.0824.
Also Read | HBAR Price Eyes $0.39 Breakout as Double-Bottom Signals Bullish Reversal



Be the first to comment