



Key Insights:
- Bitcoin price holds the 50-week EMA, while reclaiming the weekly MA opens $88,000–$90,000.
- The daily 50- and 100-day MAs crossing echoes 2023, when BTC fell 17% before rallying 546%.
- Spot Bitcoin ETFs recorded $201.81 million in net outflows, adding pressure near resistance.
Bitcoin traded near $78,000 after holding a key weekly exponential moving average. The Bitcoin price now faces resistance that could decide whether the rebound extends toward $90,000. It recently climbed from $63,000 to $79,500 within five days. That rapid advance left the market consolidating beneath several technical barriers.
Meanwhile, traders continue processing Fed Chair Kevin Warsh’s hawkish Jackson Hole speech. Brent crude rose above $90 amid tensions around the Strait of Hormuz. Spot Bitcoin ETFs added caution after recording $201.81 million in net outflows. Against this backdrop, analyst Ted identifies two decisive weekly averages.
Bitcoin Price Holds Weekly Support as Macro Risks Build
The Bitcoin price held its 50-week exponential moving average despite rejection from the 50-week simple moving average. That structure supports the recovery, although buyers still face layered resistance.
Warsh said inflation still exceeds the Fed’s 2% target. He also said summer readings did not show meaningful underlying improvement. The comments encouraged markets to reassess the interest-rate path. Higher borrowing costs can tighten liquidity and weigh on speculative assets.

Oil creates another concern. Brent reached $91.25 on Monday after U.S. forces struck Iranian launchers on Larak Island. Fears of further supply disruption drove the oil move. Higher energy costs could complicate future policy easing.
Bitcoin’s $78,000 hold shows resilience, but one session cannot establish a reliable geopolitical hedge. Meanwhile, spot Bitcoin ETFs recorded $201.81 million in net outflows on August 28. That result ended an inflow streak that had been running since August 17. ARKB led withdrawals with $114.89 million, while IBIT lost $33.40 million.
Triangle Compression Puts $78,500 and $76,000 in Focus
The four-hour TradingView chart shows the BTC price compressing inside a triangle above an ascending trendline. This consolidation follows a $16,500 advance from the recent low. Sideways trading can cool momentum without immediately reversing the broader rebound.

An upside break must first turn $78,500 from resistance into support. The recent $79,500 peak would then become the next test. Clearing both levels could expose $82,000 and the stronger $82,825 barrier.
A confirmed move above $82,825 would produce a higher high on the daily structure. Strong volume and sustained trading above that mark would make the breakout more credible. Failure there could preserve the wider sequence of lower highs.
Conversely, a triangle breakdown would bring $76,000 into view. Lower support sits near $74,000 and $73,000. Losing the rising trendline and weekly EMA together would strengthen the bearish case.
The daily chart also resembles a flag near the rally peak. Its lower boundary still holds, but a former bear-flag trendline reinforces resistance.
Bitcoin Price Analysis Maps the $90K and $74K Paths
According to crypto analyst Ted, BTC price sits between its 50-week EMA support and 50-week MA resistance. This positioning makes the next weekly close especially important.
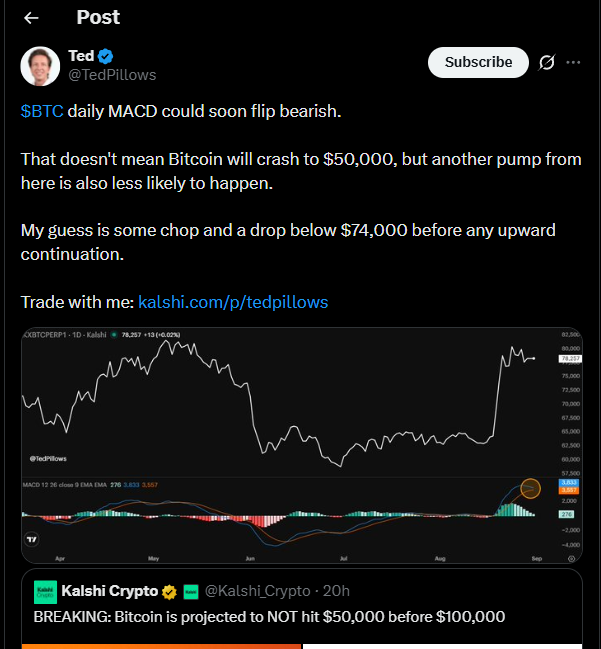
Last week’s shooting-star candle signals selling pressure near the rally peak. Nevertheless, weekly momentum readings offer a firmer counterpoint. The MACD line sits above its signal line, while RSI has broken its descending trendline. A weekly close must confirm the RSI breakout.
A daily bullish cross between the 50-day and 100-day averages adds another positive signal. The same cross appeared in January 2023. Bitcoin then fell 17% before rallying 546%. Historical data informs Bitcoin price analysis, but cannot guarantee another rally.
The daily Bitcoin price structure gives mixed confirmation. Momentum has improved since May, while the price still faces a descending structural barrier. A close above $82,825 would validate that strength and weaken the lower-high sequence.
The weekly averages provide Ted’s decision points. Reclaiming the 50-week MA supports an $88,000–$90,000 target. Closing below the 50-week EMA instead shifts attention toward $74,000.



Be the first to comment