



In brief
- Bitcoin gained nearly 25% in August, its best August since 2017, closing the month back above its 50-month moving average for the first time since last year’s crypto winter began.
- On Myriad Markets, traders are pricing a 77% chance BTC hits $84,000 before it dumps to $55,000.
- September is Bitcoin’s historically weakest month, and the daily chart shows price already stalling under a resistance wall that’s held since late August.
Bitcoin is trading around $77,500 on the first day of September, down about 1.3% on the day after closing out one of its strongest months of the cycle.
The historic rally that moved crypto markets from “fear” to “extreme greed” in record time appears now to have cooled—so where does the price of Bitcoin go next?
For context, the recent rally traces back to Treasury Secretary Scott Bessent’s decision to double the size of long-end bond buybacks on August 19, a liquidity move that hammered Treasury yields and touched off a short squeeze in crypto. Around that time, the Securities and Exchange Commission offered a framework for crypto investment contracts, adding regulatory tailwind to the move.
The rally cooled after Fed Chair Kevin Warsh used his first Jackson Hole address as chairman to warn that inflation numbers “are more concerning” than the labor market, reviving talk of a rate hike at the Fed’s September 15-16 meeting. Bitcoin briefly topped $81,000 in the days after the buyback news before slipping back under $78,000, closing out August with a monthly gain of roughly 25%, up from a 21-month low near $59,300 hit back in June.

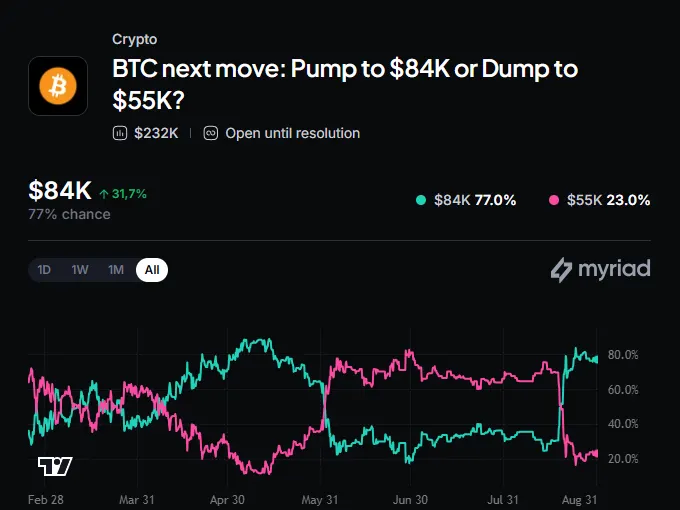
On Myriad, a prediction market built by Decrypt‘s parent company Dastan, traders are betting heavily that the rally has more room to run.
The line sits at 77% that Bitcoin reaches $84,000 before it falls back to $55,000, a lopsided read that reflects August’s momentum more than what the charts are showing right now.
Bitcoin price: What the charts say
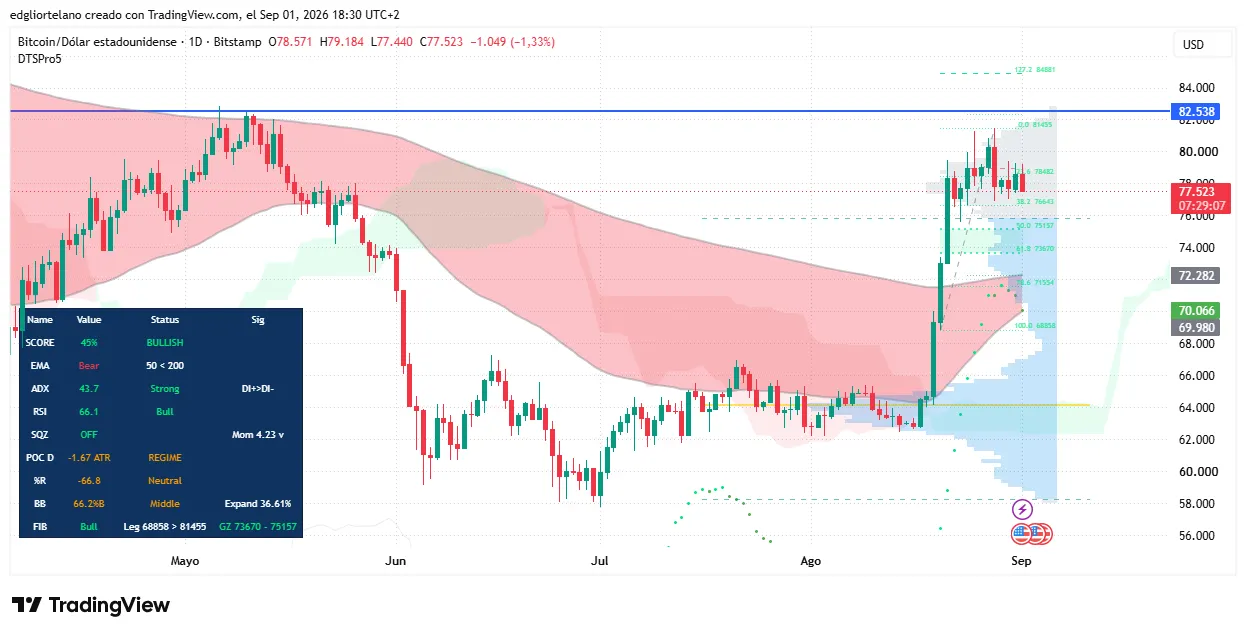
Bitcoin opened September exactly where August left off, at $78,571, before sliding to an intraday low of $77,440. That’s a small pullback, but it comes right under a resistance zone that’s proven sticky near the $82,500 price line.
The Relative Strength Index, or RSI, which measures whether an asset is overbought or oversold on a scale of 0 to 100, sits at 66.1 on the daily chart. That’s bullish territory, but it’s edging toward the 70 mark where traders typically expect profit-taking to kick in.
The Average Directional Index, or ADX, which measures how strong a trend is regardless of direction, is at a firm 43.7, well above the 25 threshold that confirms a real trend is in place. That’s a much stronger reading than the choppy, directionless action a low ADX would signal.
Here’s the wrinkle: The 50-day and 200-day exponential moving averages are still in a bearish crossover, with the 50-day below the 200-day. That’s typically read as a longer-term warning sign even during a rally, because it means the longer-term trend structure hasn’t fully flipped bullish yet, the current price has just gotten ahead of it. But the gap is shortening, which could point to a bullish crossover in the future.
Zoom out to the monthly chart and the more interesting story shows up.
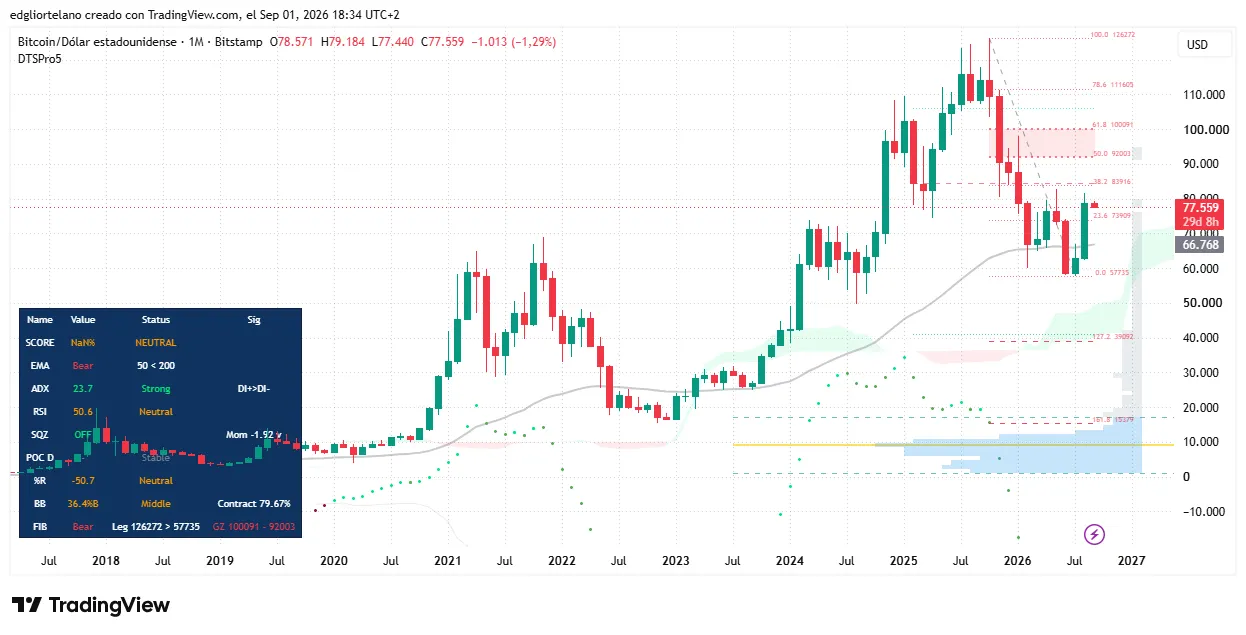
Bitcoin’s price spent essentially all of the second half of 2025 through July 2026 in a descending trajectory to trade below its 50-month moving average, the slow-moving gray line that smooths out four years of price action. That’s happened only a few times before in Bitcoin’s history: during the 2018-2019 bear market that followed the 2017 top, and again through 2022’s collapse after the Terra/LUNA and FTX blowups. Both were full-blown crypto winters.
August’s monthly candle, the biggest green bar on the chart, pushed Bitcoin’s price back above that average after reporting the best performing month since November 2024.
That’s a meaningful technical shift. But the monthly RSI is a neutral 50.6, and monthly ADX is 23.7, just shy of the 25 mark that would confirm a real trend rather than a bounce. In other words, breaking above the average ended the winter signal, but it didn’t yet confirm a new bull trend.
The macro backdrop that drove August’s rally hasn’t gone away. Treasury’s buyback program runs through the November 4 refunding quarter, spot Bitcoin ETFs have kept pulling in net inflows through the month, and the SEC’s crypto rulemaking process is moving forward rather than stalling.
A reclaimed 50-month average, combined with daily ADX confirming a genuine trend rather than noise, gives bulls a real structural argument: The winter signal that held for roughly 10 months just broke, and trend-following capital tends to chase that kind of shift once it’s confirmed on a higher timeframe.
That said, September is working against the bulls before a single new catalyst even shows up. Since 2013, September has been its weakest calendar month, and that seasonal drag is compounded this year by Warsh’s hawkish Jackson Hole tone and a Fed meeting on September 15-16 where hike odds have jumped.
Key levels to watch
- Resistance: $81,455 to $82,538 (immediate confluence zone), $92,003 to $100,091 (monthly golden zone)
- Support: $73,670 to $75,157 (daily golden zone), $68,858 (August swing low)
Disclaimer
The views and opinions expressed by the author are for informational purposes only and do not constitute financial, investment, or other advice.
Daily Debrief Newsletter
Start every day with the top news stories right now, plus original features, a podcast, videos and more.



Be the first to comment