



Bitcoin price is once again under pressure following its failure to maintain above $80,000. With a level of $77,000 forming support, weak momentum may push the price lower from here.
At the time of writing, BTC is trading at $77,546, with a 24-hour trading volume of $34.43 billion and a market capitalization of approximately $1.56 trillion. BTC is down 1.77% over the last 24 hours.
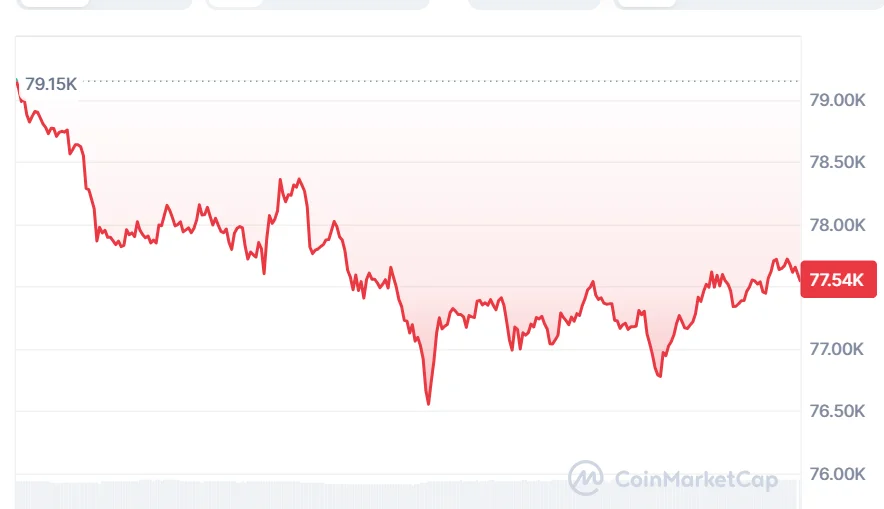
Bitcoin Price Faces a Key Support Zone
On September 2, crypto analyst Doran pointed out the range between $74,000 and $82,000 as a significant range for Bitcoin. In his analysis, he said that the asset had been fluctuating in a narrow range of approximately $77,100 to $78,500. This has prevented a strong move in any direction.
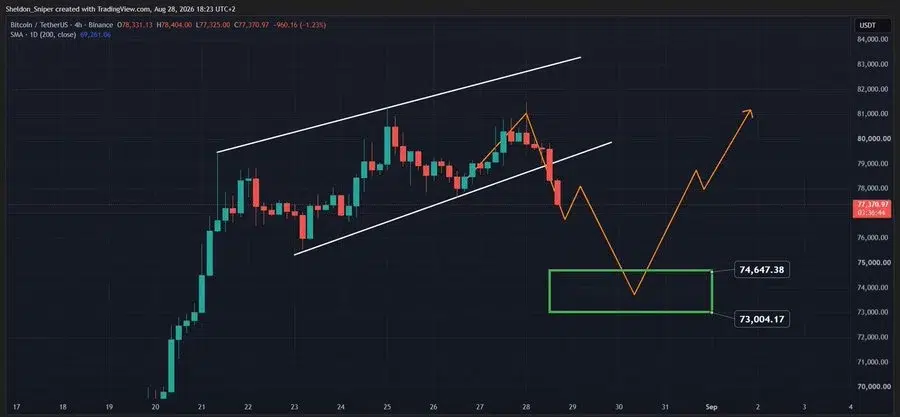
Bitcoin price was seen facing rejection at $81,500 before it fell to $77,500. Now, attention is focused on whether the coin can form strong support.

The $77,000 level has gained significant importance since some other market experts have been focusing on the same level. As per Forbes, technical expert Frank Hepworth sees the $77,000 level as crucial since a breach below would make Bitcoin vulnerable to falling to levels such as $72,000 and below, at its 200-day moving average of $69,500.
Therefore, $74,000-$77,000 becomes an important level for the upcoming direction in Bitcoin’s case. Retaining the level may offer the buyers some breathing space to make a move towards $80,000.
Also Read | Solana Price Eyes $400 After Falling-Wedge Breakout and ETF Surge
Bitcoin Technical Indicators Show Mixed Signals
Bitcoin is currently trading above the middle Bollinger Band of $73,875.89, with the upper band located at around $86,615 and the lower band near $61,137. The continued trade above the middle band implies that there is some technical support below the current level.
On the other hand, the large gap between the upper and lower bands reveals that volatility is high. The movement towards the upper band can be seen as a positive sign.
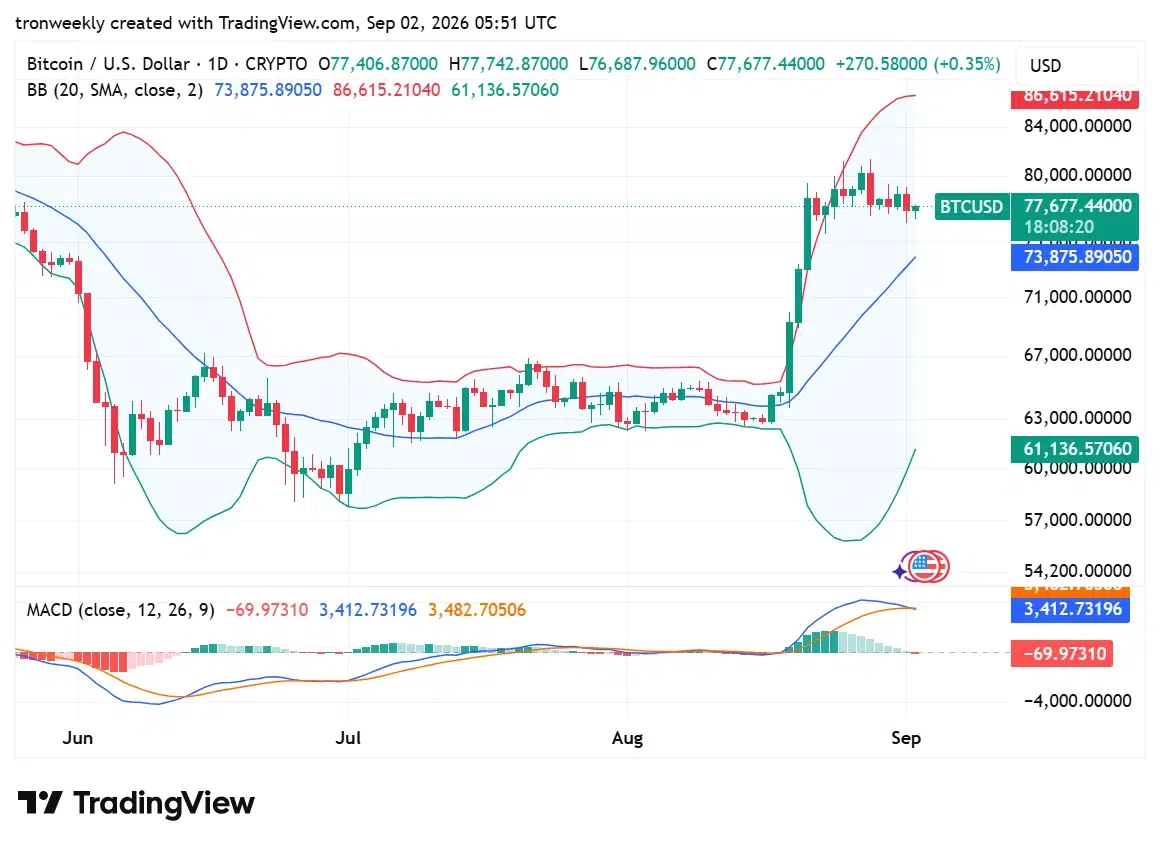
In terms of short-term analysis, however, the MACD oscillator shows a more bearish picture. In particular, the MACD line at 3,412.73 is still lower than the signal line at 3,482.71, and the histogram is negative at -69.97. This implies that short-term buying pressure has declined.
A MACD cross to the upside will thus be crucial for Bitcoin, should it manage to hold above its support level.
What Happens Next for Bitcoin Price?
Bitcoin’s near-term focus is on $77,000 to $78,500. Holding the $77,000 level and an improvement in momentum readings will allow for another attempt at $80,000 to $82,000. Breaking out above this range would create a better short-term structure for future rallies.
Meanwhile, a loss of $77,000 might refocus the market’s attention on the $74,000-$73,000 range. An even lower drop below this level might draw more attention to $72,000 and then to the 200-day MA at $69,500.
Right now, Bitcoin is stuck in the zone of conflicting forces – strong support from below and strong resistance from above. The next major move will largely depend on how well BTC is able to hold the $77,000 range under the influence of macro factors, oil, rates, and ETFs.
Also Read | Bitcoin Faces September Risk After 2 Green Months in 2026


Be the first to comment