


What to know:
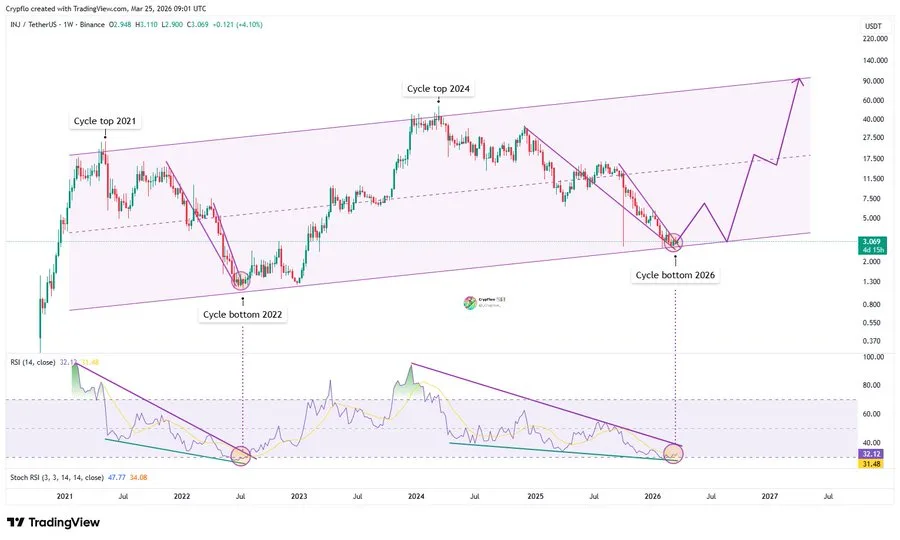
- Injective (INJ) approaches a potential cycle bottom near $3, echoing 2022 lows.
- Weekly structure shows a sustained bearish trend with lower highs and lower lows.
- Momentum indicators suggest selling pressure may be easing, hinting at a gradual recovery.


Injective (INJ) is showing signs of aligning with its long-term cyclical pattern, with current price action nearing the lower boundary of its historical rising channel.
This channel, which has contained INJ since its early market phase, links major highs from 2021 and 2024 while marking cycle lows in 2022 and the projected 2026 area.

Analyst CrypFlow notes the consistency of this channel, indicating that INJ trades within a structured macro rhythm rather than random volatility.
The 2021 peak initiated a sharp correction into 2022, a low reinforced by oversold RSI conditions. From there, a recovery pushed prices to the 2024 cycle top, but momentum was already weakening.

Source: X
The Relative Strength Index (RSI) showed a lower high compared to the previous peak, hinting at bearish divergence and a slower buildup toward the current corrective structure.
The present downtrend is forming lower highs and lower lows, mirroring patterns from prior cycles, while the RSI now approaches oversold levels similar to the 2022 bottom.
This convergence of structural support and momentum exhaustion indicates the $3–$4 region may act as a significant accumulation zone for investors anticipating the next market cycle.
Also Read: Injective (INJ) Price Accumulation Signals a Potential Rally Toward $4.25
Technical Indicators Confirm Bearish Trend For Injective
Analysis from TradingView highlights that Injective (INJ) is transitioning from a strong bullish expansion into a sustained bearish trend.
After the early 2024 rally, the price began forming lower highs and lower lows, constrained by a descending channel and downward-sloping trendlines.
Weekly price action shows persistent selling pressure, with any attempts to reclaim prior swing highs failing to gain traction.
Moving averages reinforce this bearish structure. INJ currently trades below the 20, 50, 100, and 200 EMAs, which are stacked in bearish alignment. This setup suggests rallies into the EMA zones are likely to face resistance rather than trigger reversals.

Source: TradingView
Price compression near the $3–$4 zone signals reduced volatility, but a clear base has not yet formed, leaving INJ vulnerable to further downside if the demand zone fails.
Path to Recovery May Be Gradual
While the current structure is bearish, momentum indicators provide early signs of relief. The RSI trend mirrors previous cycle bottoms, and the stochastic RSI sits in the lower range, suggesting that selling pressure may be nearing exhaustion.
Market participants could see a multi-stage recovery: an initial bounce, followed by consolidation, and eventually a gradual climb toward higher levels within the channel.
This article contains market analysis and price predictions. These are not guarantees. Crypto markets are volatile. Always DYOR. Not financial advice.
Also Read: Injective INJ Price Rebounds from $10 Support, Eyes Breakout Above $18 Resistance

Be the first to comment