


Arbitrum [ARB] is up 23% in the past 24 hours, at press time. Measured from Monday, the 31st of August, the Arbitrum token is up by 61.6%. Notably, Coinalyze data showed that Open Interest has risen by 30% in the same time period.
Funding Rates were also positive after briefly falling into negative territory on the 2nd of September. This meant market participants were eager to take long positions to make profits from the strong upward momentum.
Additionally, the token reached a market capitalization of $904 million, the first time it has surpassed $900 million since January. Arbitrum reported an income of $6.2 million for the first half of the year. Strong Robinhood Chain revenue was driving ARB appreciation.
The chain set a new all-time high of $4.5 million in daily fee revenue, and 10% of the Robinhood Chain fees are shared with the Arbitrum Foundation.

Is ARB price overextended?
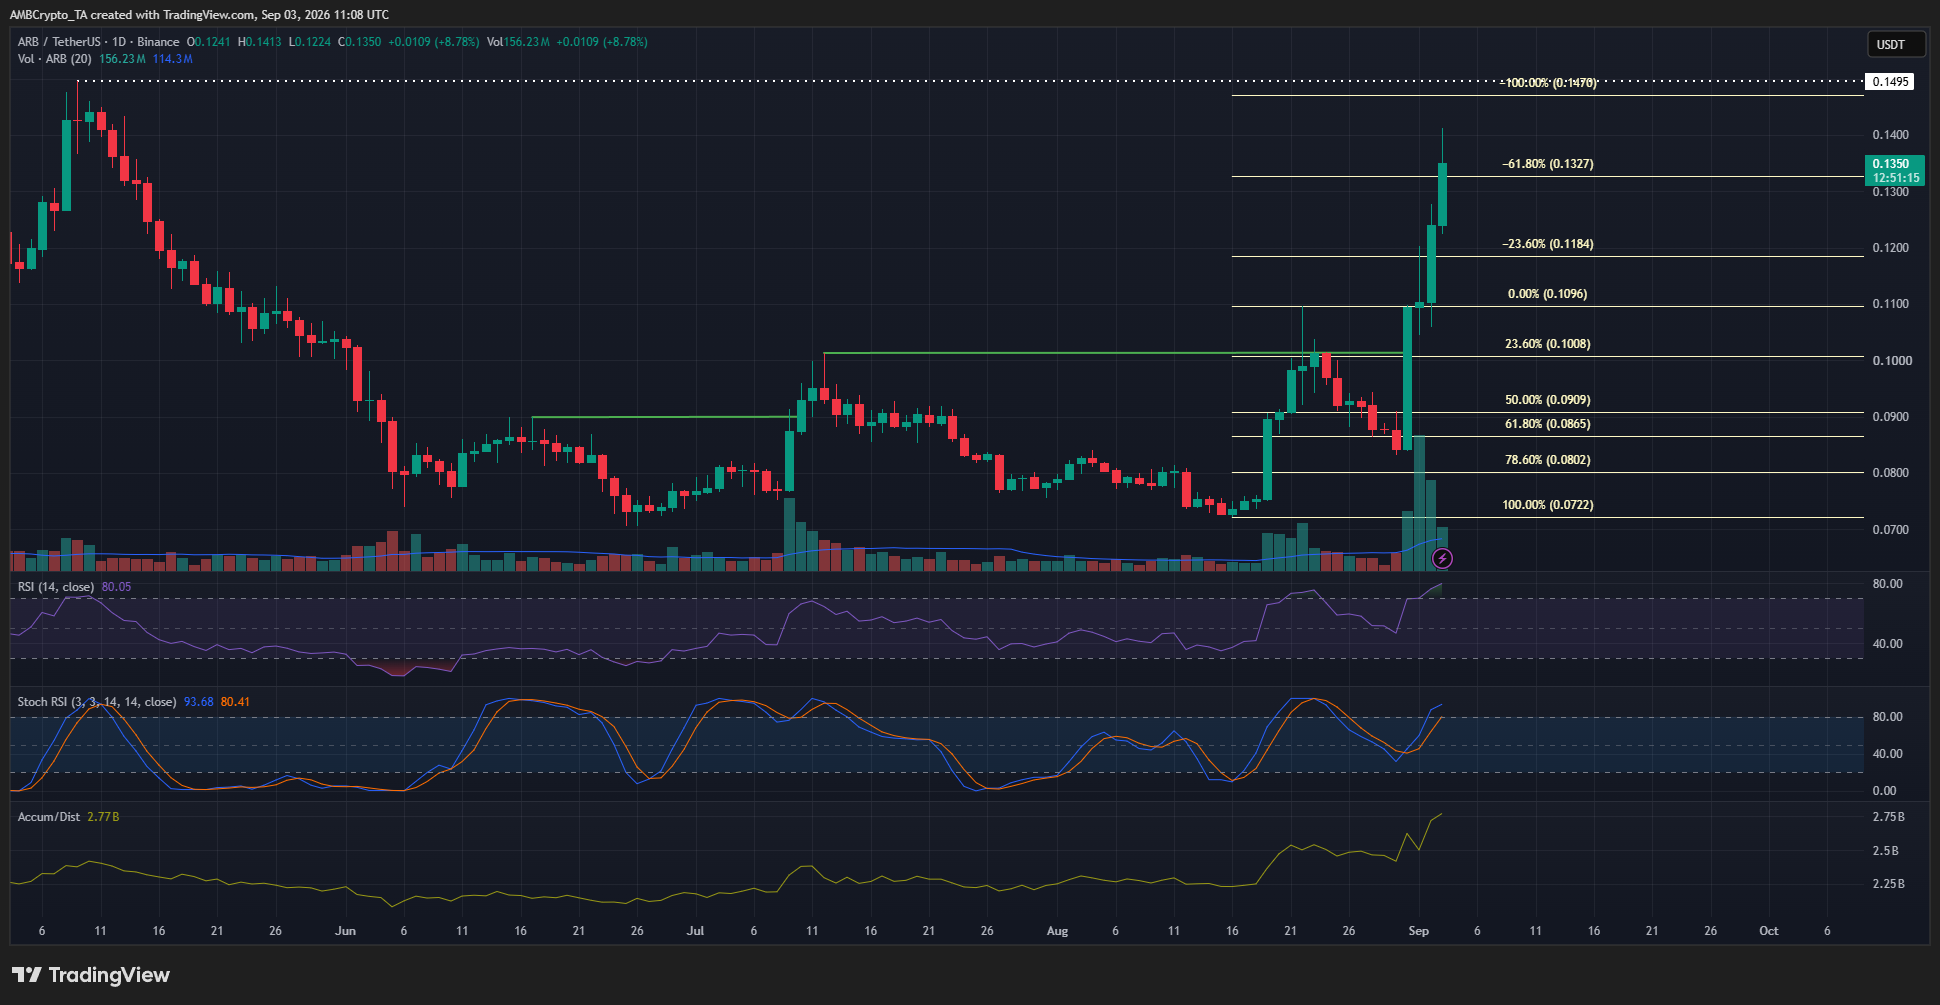
A bullish swing structure on the 1-day timeframe was established in July, and continued in August. The latest move higher originated at $0.072, and reached $0.109 two weeks ago before retracing toward $0.08.
This retracement has been reversed by this week’s surge in demand. High trading volume and intense buying pressure pushed the momentum and volume indicators bullishly.
The RSI on the daily timeframe was at 80.05 as of writing, the first breach of the 80 level since the 10th of May, 2025. The Stochastic RSI looked to be on the verge of a bearish crossover.
In other words, there is a chance of a correction from overextended market conditions.
Why Arbitrum traders should wait for a pullback
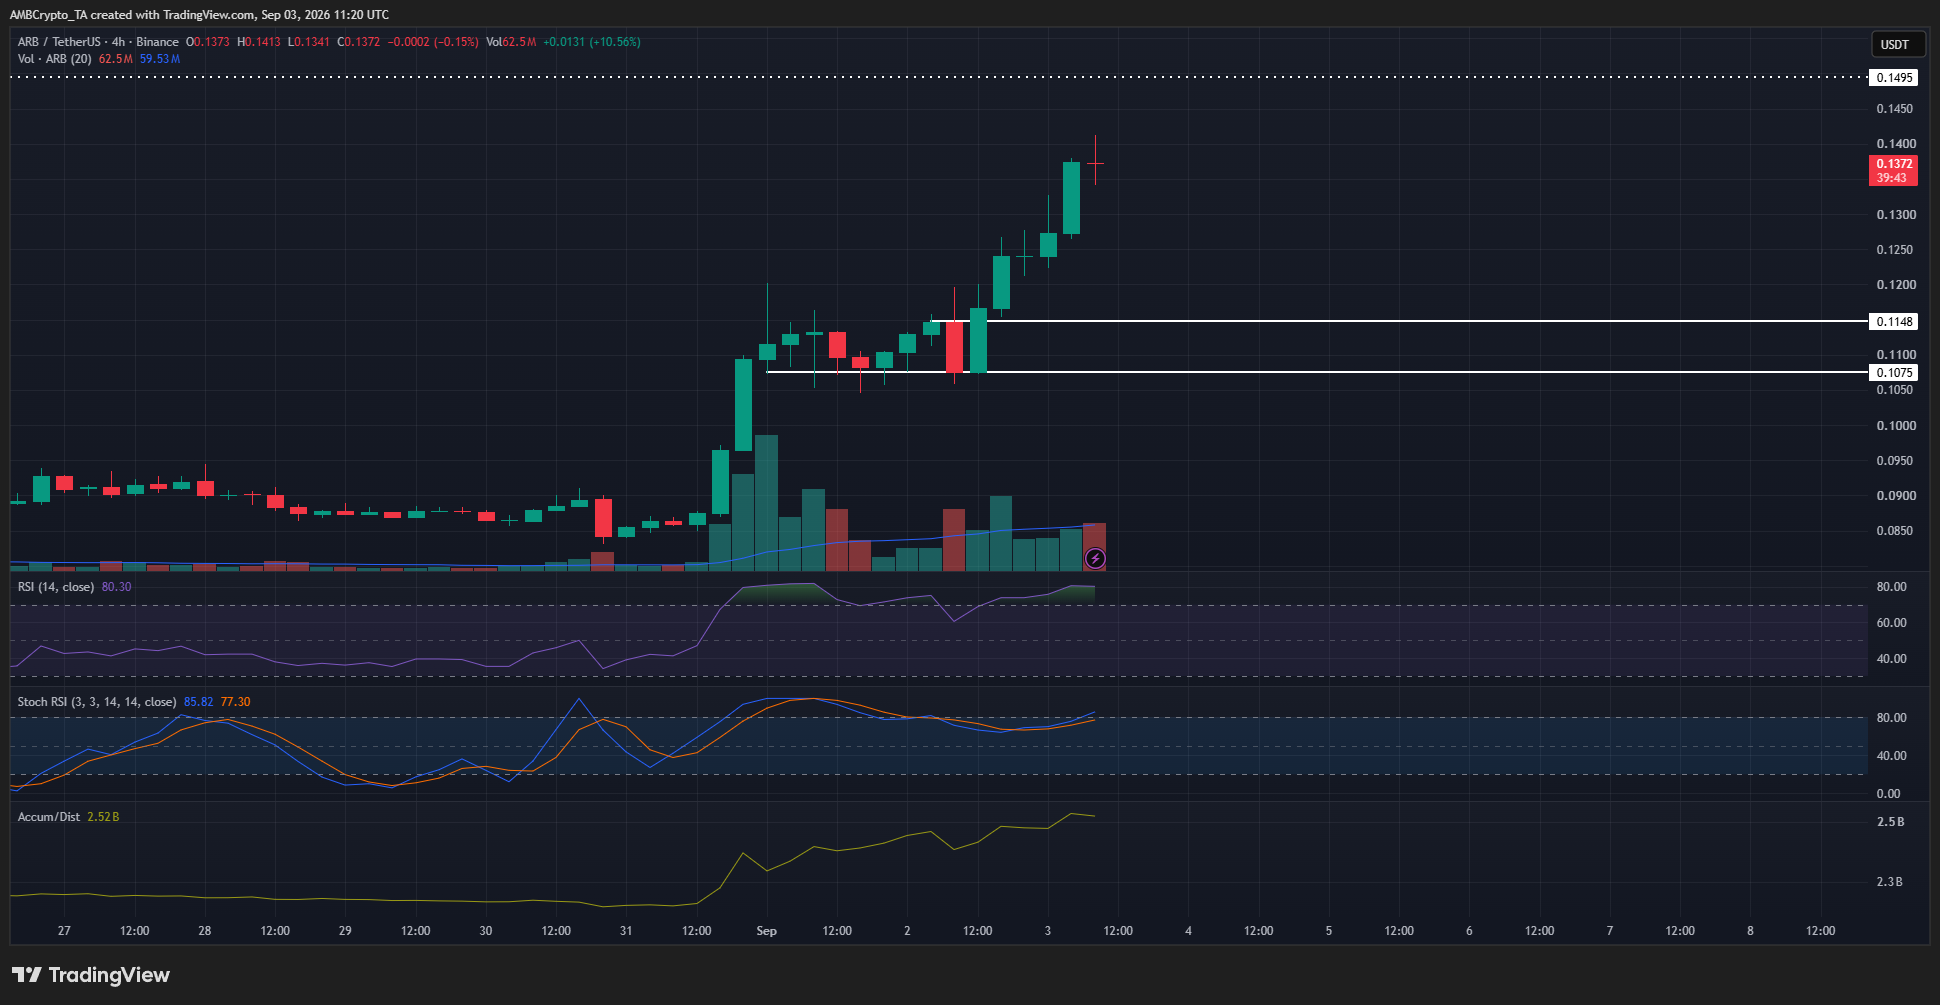
Given the higher timeframe momentum, a deep ARB correction did not appear likely. A slowdown in the Robinhood Chain trading frenzy might provide a price dip, but for now, the momentum is fully in favor of the buyers.
The $0.108 and $0.115 are the support levels to watch in case there is a pullback. A retest of this area could offer a buying opportunity.
Alternatively, a breakout past the weekly resistance zone at $0.1495 and a retest of the $0.150 area could drive the next move higher. A price dip below $0.108 would shift the short-term price bias bearishly.
Final Summary
- Surging DEX volume on Robinhood Chain and high daily fee revenue numbers have driven Arbitrum’s price higher.
- In the short-term, the $0.150 resistance level and the $0.108-$0.115 demand zone are the ones to watch out for.



Be the first to comment