



One of Shiba Inu’s most significant exchange metrics is drastically shifting in the opposite direction, despite the token being under fresh selling pressure. As the token tests a crucial technical area, SHIB’s seven-day average exchange outflow has increased by more than 100% in a single day, possibly offering some support.
Exchange outlfows are rising
Exchange Outflow (Mean, MA7) is estimated to be 579 million SHIB based on on-chain data, up 121.26% over the previous day. The rise is significant because exchange outflows typically indicate that tokens are leaving trading platforms. This may lower the quantity of immediately liquid SHIB that is available for sale if it continues.
But there’s a catch. Inflows are growing even more rapidly. Exchange Inflow (Mean, MA7) increased by 182.3% to roughly 1.68 billion SHIB. With 318.28 billion SHIB in total inflows and 231.74 billion in outflows, the total exchange netflow was positive at roughly 86.53 billion SHIB.

Because of this, the signal is far less bullish than the outflow increase alone would indicate. More SHIB is being withdrawn by investors, but an even greater sum is concurrently arriving at exchanges. As a result, exchange reserves have increased by 0.1% to about 87.29 trillion SHIB.
You Might Also Like

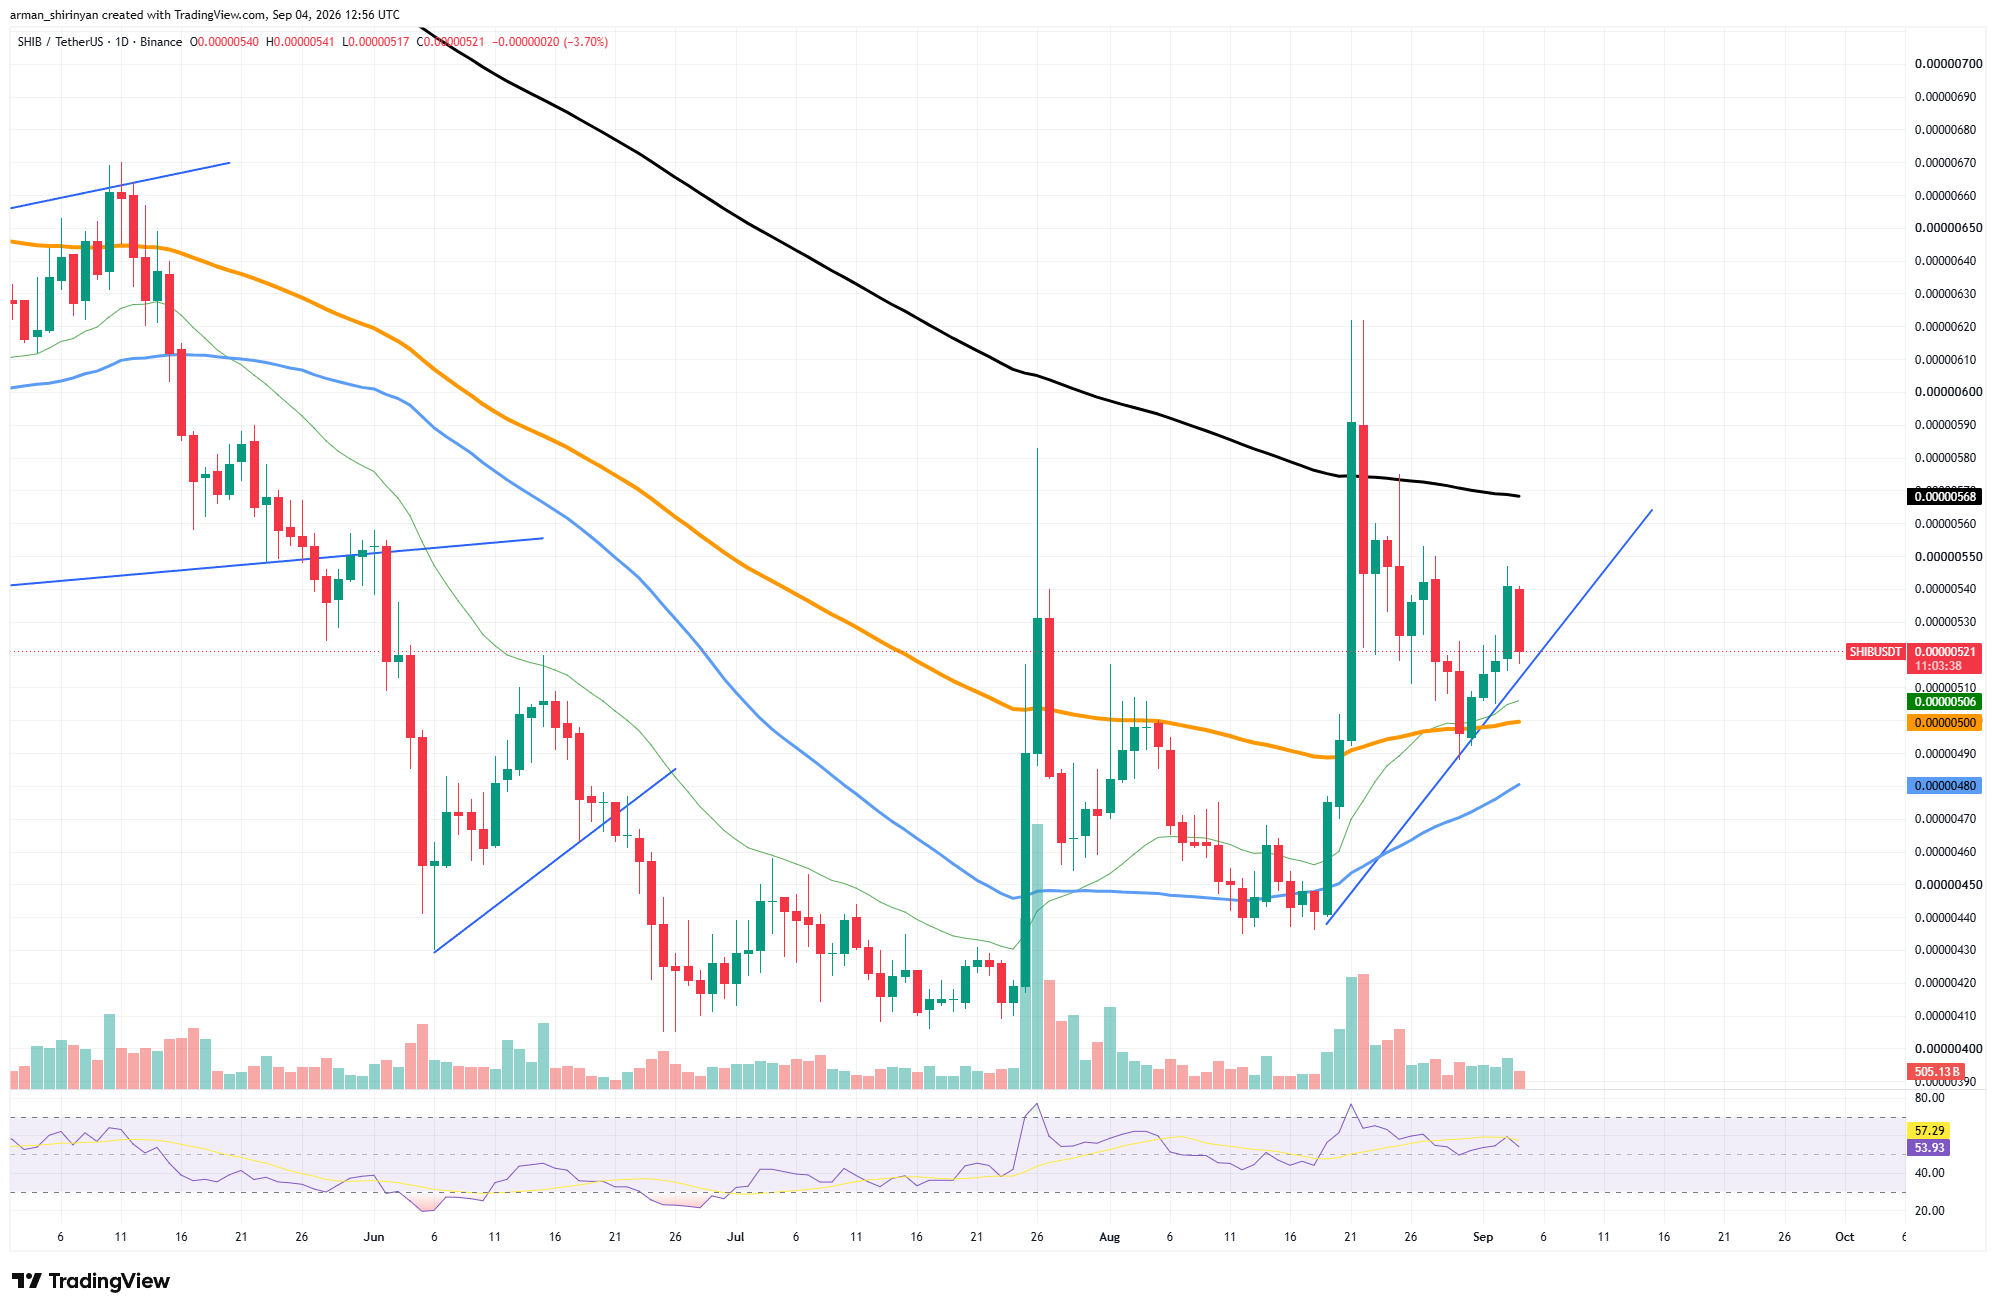
Because SHIB is currently under technical pressure, the timing is crucial. The token has dropped nearly 4% on the daily candle and is currently trading close to $0.00000520. The major long-term moving average is still at $0.00000568, but its recent recovery was rejected at $0.00000540.
Critical support is closer
SHIB is now getting close to a crucial support cluster at $0.00000500. This is where the major moving averages and the rising short-term trendline converge. Additionally, the RSI has dropped to roughly 53.7, indicating a weakening of bullish momentum without entering oversold territory.
Therefore, the 121% increase in outflow may help ease some short-term supply pressure, but it cannot “save” SHIB on its own. The greater inflow spike and positive exchange netflow indicate that there is still a significant amount of sell-side liquidity.
$0.00000500 is the critical level for bulls. Holding it allows for another attempt at $0.00000540–$0.00000568 and preserves the August recovery structure. Instead, a clear breakdown would reveal about $0.00000480, which would be followed by the larger August support zone around $0.00000440.



Be the first to comment