


What to know:
- Solana (SOL) faces short-term pressure after rejection at $93, testing a key support zone.
- Trading below its 20- and 50-day moving averages, momentum indicators signal weak price strength.
- If support holds, SOL may attempt a bounce; a break could lead to further downside.

Solana (SOL) is currently facing some challenges on its short-term charts as the price has experienced a pullback. The price of the coin is currently near support, which could be the next trigger for the price. The coin has not been able to sustain its price movement after the rejection at its high price.
At the time of writing, Solana (SOL) is trading at $87.45, with a trading volume of $5.62 billion within the last 24 hours and a total market capitalization of $50.21 billion. The price of the coin has fallen by 5.70% within the last 24 hours, as the selling pressure continues at higher levels.

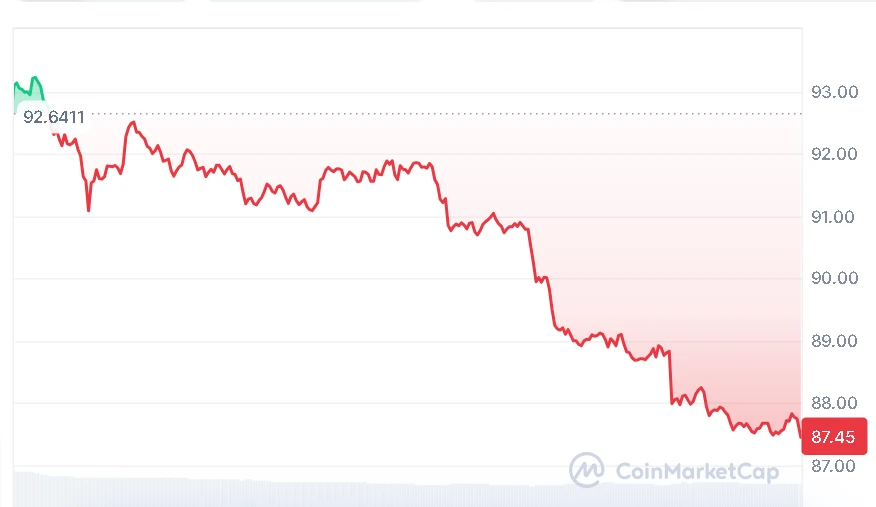

Source: CoinMarketCap
Solana Retests Key Support After Rejection
As crypto analyst BitGuru explained in a post on X on March 26, 2026, Solana has now returned to a historically important support zone after being unable to break through the resistance at $93.
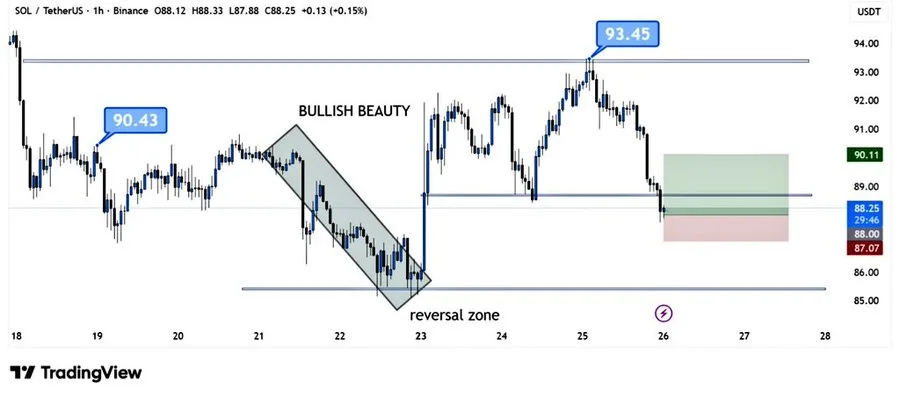

Source: BitGuru’s X Post
This level is now considered an important zone, where the next direction of the token’s price may be determined. If the buyers enter the market, the price of SOL may try to bounce back towards higher resistance levels.
Solana Weak Momentum Below Key Averages
The current price of the Solana coin is trading at a level that is below the short-term moving averages of the coin. This indicates that the coin has low price strength. The coin has a 20-day moving average of 88.63 and a 50-day moving average of 86.09. This indicates that the price movement of the coin is highly uncertain.
However, Solana is still under pressure. The price is still trading below the 100-Day MA, which is currently at $106.54. The price is also trading below the 200-Day MA, currently at $143.24. This indicates that the price is far from attaining bullish momentum.
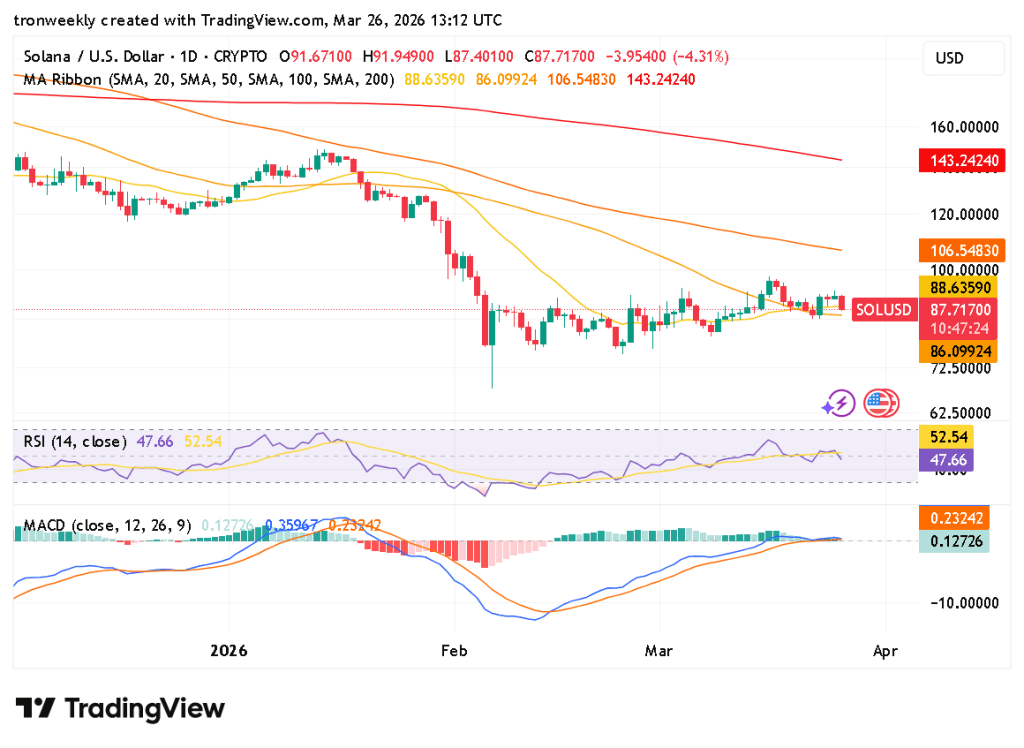
Source: TradingView
The momentum indicators show that there is low strength. The RSI is currently at 47.66, which is below its signal line of 52.54. The MACD line is currently at 0.127, which is below its signal line of 0.232. The flat line of the MACD histogram shows low directional conviction.
Also Read | US Sees Alarming Surge in Foreign Holdings of Treasuries: $9.3 Trillion Record High in January 2023
Solana Tests Critical Support Zone
In the short term, the key area of interest will be the support zone, which is currently being tested. If the support zone holds, it may open the doors for the price to potentially bounce and move higher. However, if the support zone fails, the price of Solana may experience further pressure, potentially moving lower.
This article contains market analysis and price predictions. These are not guarantees. Crypto markets are volatile. Always DYOR. Not financial advice.
Also Read | Solana Eyes $102 Breakout as $95 Resistance Meets Mixed Trend Signals
Be the first to comment