



Bitcoin price continues to hold steady around $79,000, with large ETF inflows supporting demand, as market players watch out for the crucial resistance level of $80,000.
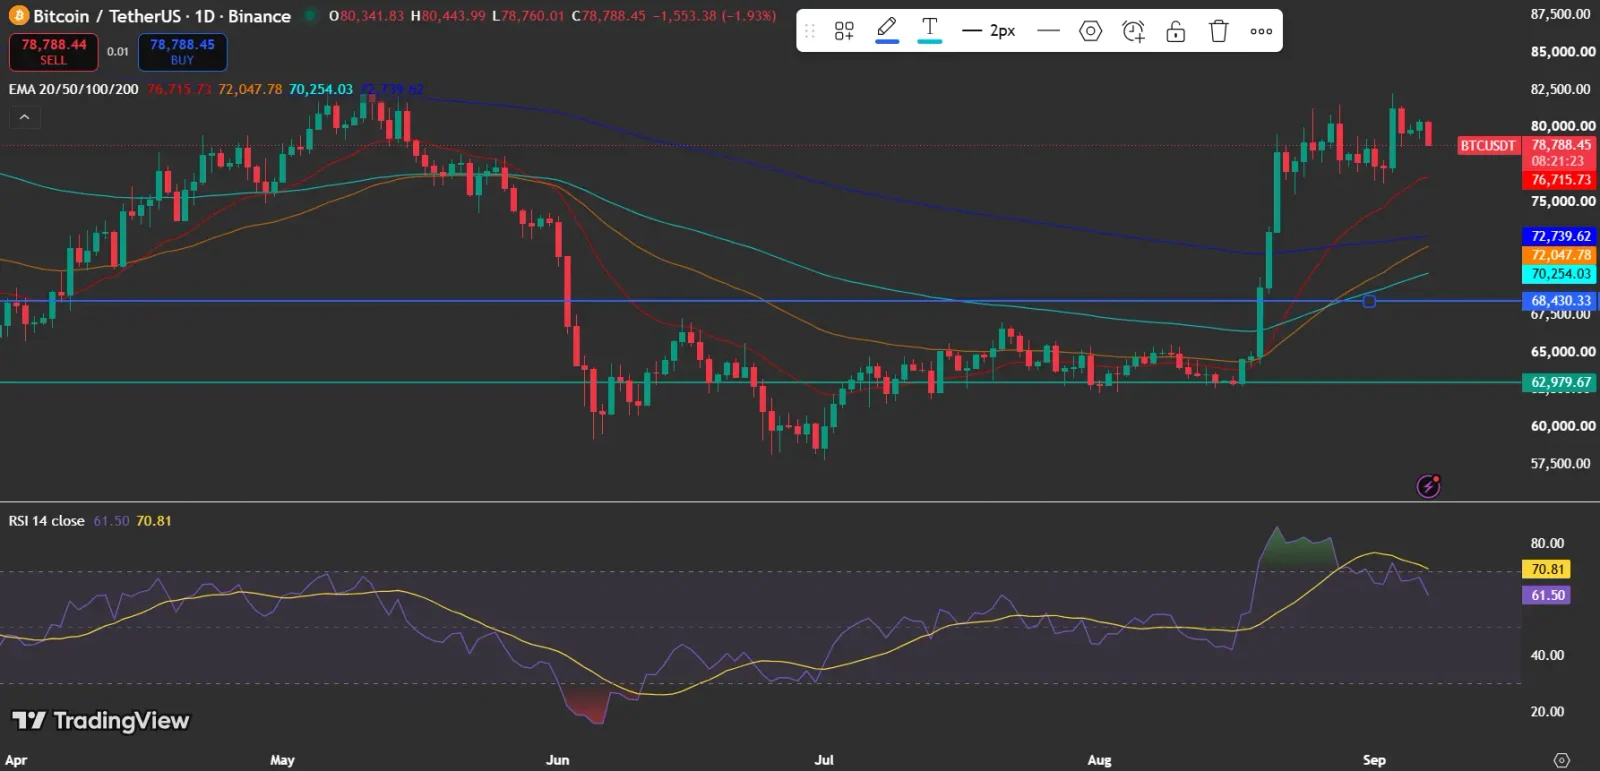
At the time of writing, Bitcoin price is trading at $78,788.45, showing a drop of 1.93% from its price yesterday. This decline has brought down short-term momentum, but BTC is still hovering above its main moving averages.
Also Read: Capital B Buys 376 Bitcoin for €25.3M, Holdings Reach 3,521 BTC
Bitcoin Price Remains Above Key EMAs
TradingView’s daily chart suggests that Bitcoin Price is trading above its 20-day, 50-day, 100-day, and 200-day exponential moving averages (EMAs). More specifically, the 20-day EMA stands at $76,715.73, the 50-day EMA – at $72,047.78, the 100-day EMA – at $70,254.03, and the 200-day EMA – at $72,739.62.

Thus, it becomes evident that there are still buyers protecting the uptrend. In particular, the near-term resistance stands at $80,000, while a break above this level could bring the recent $82,500 area into focus.
What Does Bitcoin Price RSI Suggest?
The relative strength index (RSI) of Bitcoin for 14 days is 61.50 and it is below the overbought level in general. The RSI is trading lower than the recent highs, which points towards a reduction in bullish momentum in the ongoing consolidation period.
On the other hand, an RSI reading of more than 50 means that the momentum is positive. This, along with the prices trading above the key exponential moving averages, supports the bullish case despite weakness in the short term.
Also Read: Coldcard Wallet Hack Escalates as Attacker Moves 45% of Stolen Bitcoin
How Do Bitcoin ETF Inflows Affect Bitcoin Price?
As reported by Lookonchain, Bitcoin exchange-traded funds witnessed net inflows of 2,038 BTC in a day’s time, equaling around $161.83 million. In a span of seven days, there was a total of 11,093 BTC in net inflows, totaling up to around $880.76 million.
Lookonchain highlighted the latest flow data as “1D NetFlow: +2,038 $BTC (+$161.83M)” and “7D NetFlow: +11,093 $BTC (+$880.76M).”
The figures above present a strong demand signal while Bitcoin price is trading under $80,000. Continued ETF inflows could help absorb selling pressure near resistance levels.
What Does Bitcoin Open Interest Show?
CoinGlass shows that the open interest of Bitcoin is about $53 billion, while trading volume has recorded several elevated spikes in recent weeks. This suggests the existence of strong derivatives positioning in the market.
For the bulls, the key confirmation level stands at $80,000. The first support can be found close to the 20-day exponential moving average of $76,715, while a stronger breakdown would put the market at risk of retesting the $72,739 area.
Also Read: Bitcoin vs Gold: CZ Says $1 Million BTC Could Come Much Sooner
What the ETF Data Says About Flows Into Bitcoin ETFs
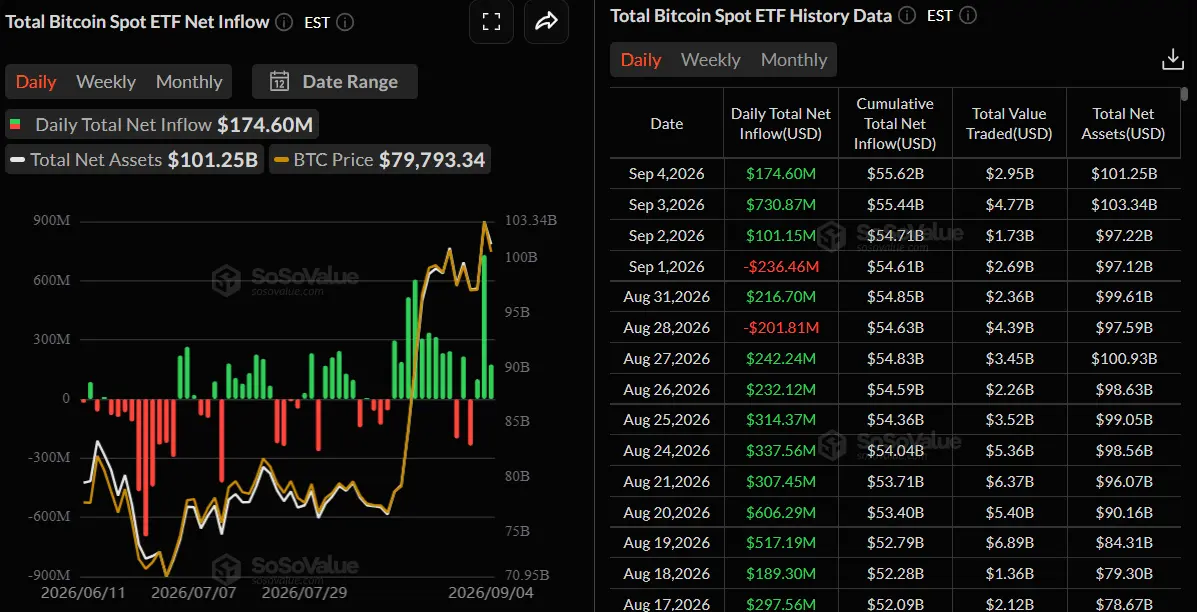
Based on the information from SoSoValue concerning Bitcoin spot ETFs, the flows amounted to $174.60 million on September 4, while total net assets stood at $101.25 billion.
In addition, the data shows that cumulative net flows reached $55.62 billion, highlighting the strong demand for Bitcoin spot ETFs.
The SoSoValue figures add further context to the latest ETF data provided by Lookonchain. Even though the two datasets refer to different dates, they reflect continued demand for Bitcoin ETFs while the cryptocurrency trades below the major resistance at $80,000.
What Trader’s Should Watch Next ?
Bitcoin’s technical setup remains positive, with $80,000 as the main resistance and $76,715 acting as immediate support. The considerable ETF inflows reported by Lookonchain and SoSoValue provide further support for Bitcoin.
A move above $80,000 could strengthen the bullish setup, while trading below the 20-day EMA could put additional selling pressure on BTC.
Also Read: Bitcoin OG Spending Doubles as BTC Hovers Near $80K
This article contains market analysis and price predictions. These are not guarantees. Crypto markets are volatile. Always DYOR. Not financial advice.



Be the first to comment