


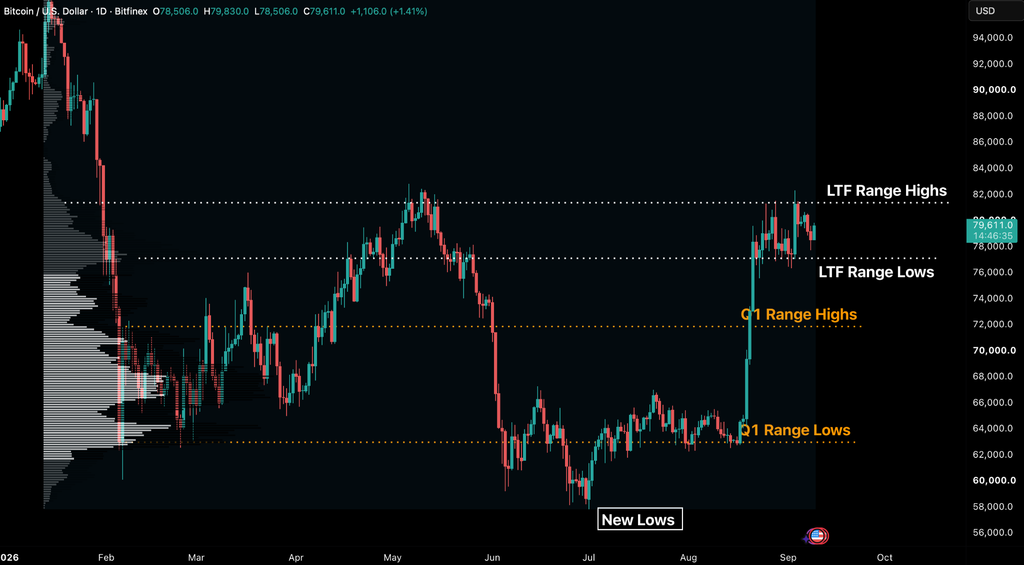
Bitcoin has traded between a $77,100 and $81,300 range across the past 20 trading sessions. At the time of writing, the True Market Mean of $76,800 is aligned with current range lows.
This is a critical level. The current range low of $77,100 is the price at which the most spot volume has been traded in 2026, outside the Q1 range of $62,500 and $71,000 (see Figure below). In order to maintain the current mid-timeframe uptrend, price has to continue trading above this threshold.
This level is significant because $77,100 is roughly the same point where BTC broke down in May, when the level was rejected as resistance and price continued to decline.
The range high of $81,300 is also consistent with the May highs. Above it there is a “volume vacuum,” with very little historic trading activity between $81,300 and $86,500. On any breakout above this threshold, we expect price to move towards the upper end of this vacuum fairly quickly, in line with historical activity at these levels.

Our overall market view remains that we expect BTC to continue to trade within the current range, with $77,100 acting as an uptrend invalidation level should price break through this level, while $81,300 is acting as a shelf. We see most current trading activity in the last two days taking place in the middle of this range.
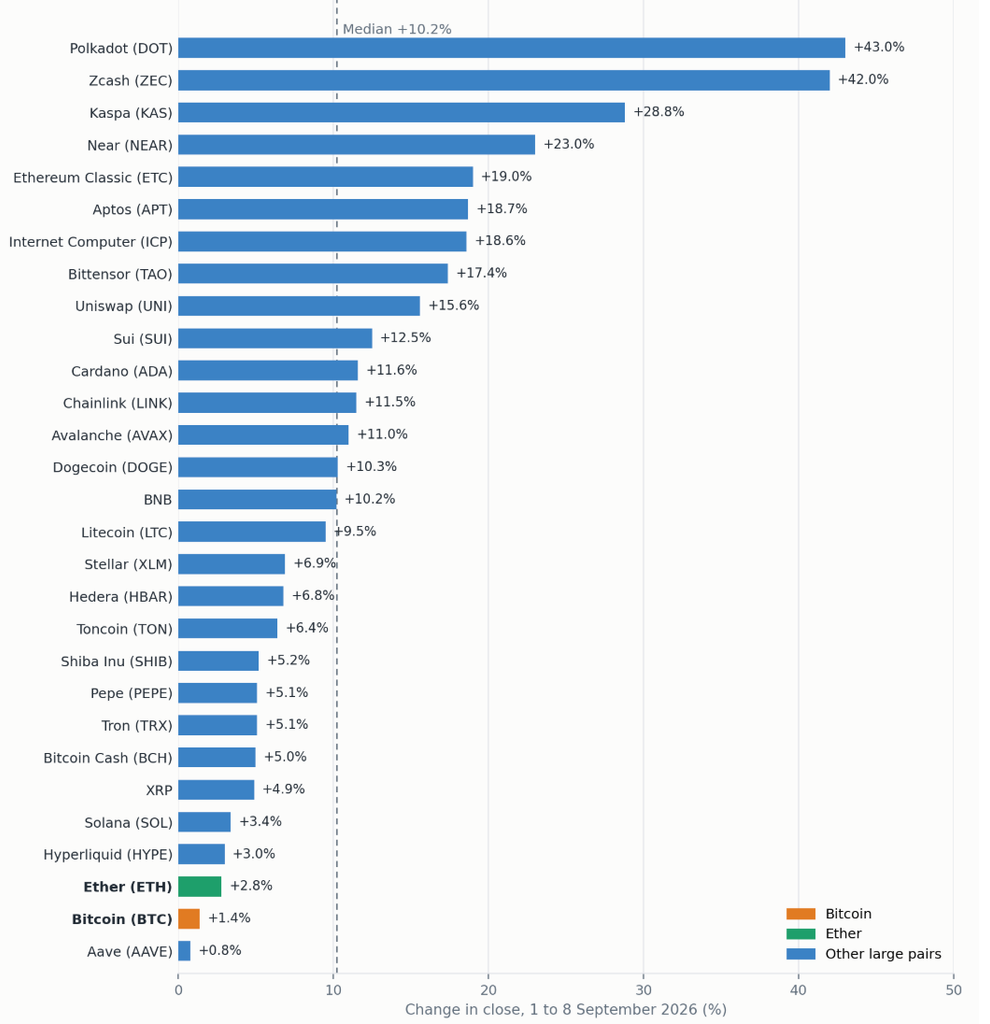
Any selling is currently concentrated and well absorbed. Interestingly, the two heaviest hours of the week so far were on Monday 7 September, a US holiday, with the ETF market closed and relatively low spot volumes, which saw a 1.56 percent move lower on the day. While BTC volatility dropped, volumes did not leave the market, evidenced by every one of the 29 largest crypto pairs by market capitalisation closing last week higher, with Bitcoin ranked second-last (see Figure below).
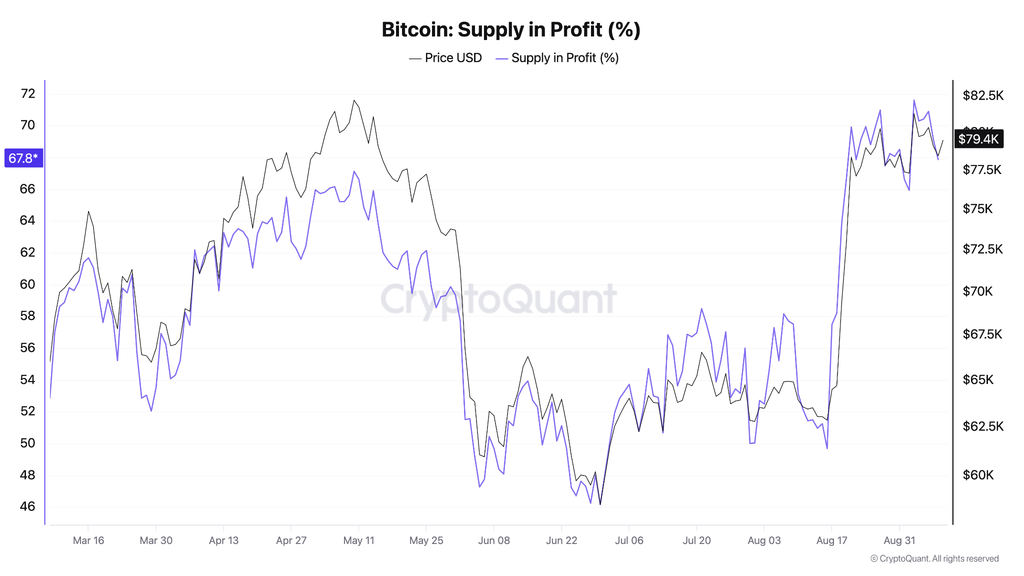
Price is Trading Where Most Holders Bought
The minor pullback from range highs indicates that many holders have a cost basis just below the current market price. Between the weekly open at $80,137 and Tuesday’s low of $77,714, which is the current weekly low, BTC pulled back over 3.4 percent. Throughout this move, the supply held in profit fell from 70.9 percent to 67.7 percent, representing roughly 640,000 BTC that went from a paper gain to a paper loss. A band this dense in holder cost helps to explain why markets are spending time negotiating this level, with so many participants at break even. Such levels historically see heavy trading volumes as holders defend their cost basis.
The long-term holder Spent Output Profit Ratio (SOPR) measures whether the average supply held by long-term holders of 155 days or more is being moved at a profit or loss. It spiked to 1.39 on 5 September, implying that the coins moved that day were sold for 39 percent more than they cost. The overall average of the metric, however, remains a more modest 1.06.
It is also important to note that long-term holders actually accumulated BTC throughout the drawdown from the $126,110 all-time high to the $57,803 bear market low reached on 1 July, with up to 16.84 million BTC held by this cohort. There has been modest profit-taking since the mid-August breakout and throughout the past 20 trading days of our current range, but total LTH supply is currently at 16.7 million BTC (see Figure below).
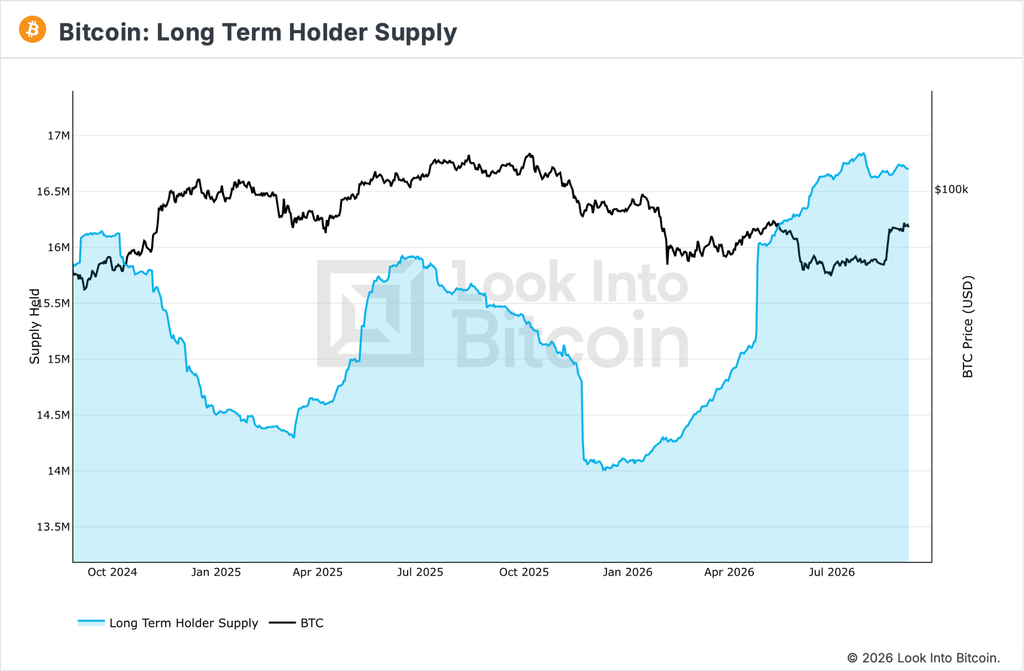
The pace of distribution is also much slower than the pace of accumulation. This started in November 2025 and remained constant until July 2026. We estimate that a majority of the profit-taking has actually come from the “newer” long-term holders, as in the holders that are closer towards the 155-day threshold of qualifying as a LTH rather than buyers that have held for multiple years. This is a positive sign indicating that the uptrend remains relatively healthy.
The SOPR metric printed 1.39 on Saturday and 1.32 on Sunday, which implies profit-taking of coins bought near $57,000 and $61,000. SOPR then fell to 1.13 on Monday and Tuesday, implying movement of coins purchased nearer $69,800. The oldest and cheapest coins that wanted to leave near $80,000 have now largely done so. The remaining selling comes from holders who bought around the short-term holder cost basis, currently $70,956.
Aggregate SOPR of all cohorts currently is at 1.002, indicating that the market as a whole is seeing BTC changing hands at break-even. This is one of the major reasons why price is oscillating in a narrow range. With supply in profit also ranging between 68.7 to 71 percent, it is still below the 74.7 percent level that has historically marked the change from a bear market to a bull market. At these levels, this remains a relief phase inside the bear market rather than a new regime until that line is crossed.
Options Hedging Increasing Around Mid-September Fed Decision
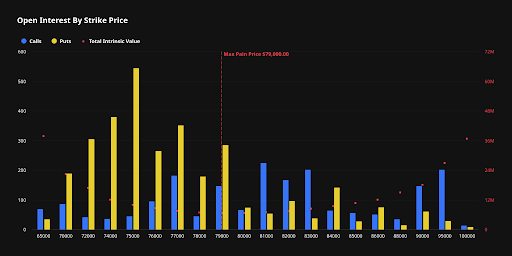
The options market has spent the past three trading sessions moving its protection from one expiry date to another. Current open interest for the 18 September expiry, which is the first to have data from Friday’s CPI print and the 16 September Fed rates decision, has grown 42 percent to 12,961 contracts, and puts per call have risen from 0.61 to 0.77, with its two largest lines of puts struck at $72,000 (1,916 contracts) and $74,000 (1,308).
The 11 September expiry has moved in reverse, as its settlement time of 08:00 UTC puts it four and a half hours before CPI is released at 12:30 UTC. It therefore carries no CPI risk at all. Puts per call have fallen from 0.77 to 0.62, with its largest option line an $81,000 call with 4,411 contracts.
Options market participants have moved their protection onto the expiry that holds the Fed decision, while the upside positions sit on the expiry settled before either CPI or the Fed decision is known.
The price being paid for protection has also risen. Implied volatility is the price of an option expressed as the size of move the market expects. It currently stands at 41.2 on the 18 September expiry against 39.0 on the 25 September quarterly and 38.2 for October, so the market now prices the next nine days as more volatile than the weeks after them. There is a potential for price to break out from our current range over the short-term if the macro catalysts outlined do end up being significant and that would change the options roadmap moving past that period.
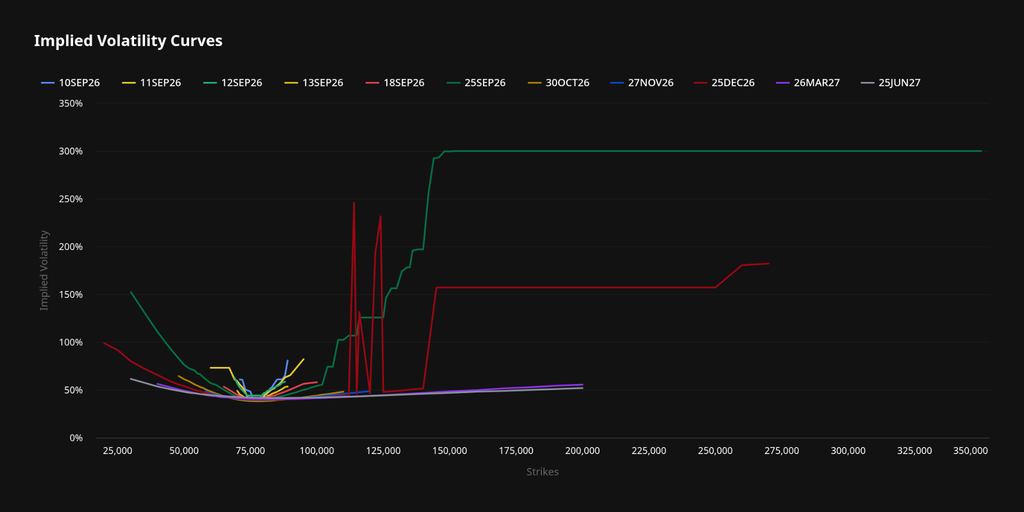
This year’s eight CPI release days have produced an average close-to-close move of 2.1 percent in BTC, so the current options positioning is priced at roughly two and a half average CPI days for a window holding four scheduled events (PPI, CPI, the Clarity Act cloture vote and the Fed rate decision). It remains cheaper than the 46.8 percent realised volatility observed on BTC over the past 30 days.
Altcoins Take the Volatility While Bitcoin Remains Subdued
Bitcoin’s quieter week has not been reflected in the rest of the market. Every one of the 29 largest liquid pairs rose between 1-8 September, with a median gain of 10.2 percent against 1.4 percent for Bitcoin.
Polkadot led with a 43 percent gain, followed by Zcash at 42 percent, Kaspa 28.8 percent, Near 23 percent, Ethereum Classic 19 percent and Bittensor 17.4 percent. Ether gained 2.8 percent and its cross against Bitcoin rose from 0.0313 to 0.0317. Bitcoin Dominance, which is BTC’s share of total crypto market capitalisation, fell from 60.4 to 59.2 percent since the beginning of the month. Most of the weekend’s altcoin gains were made in the Asian session on Sunday while BTC itself was flat.
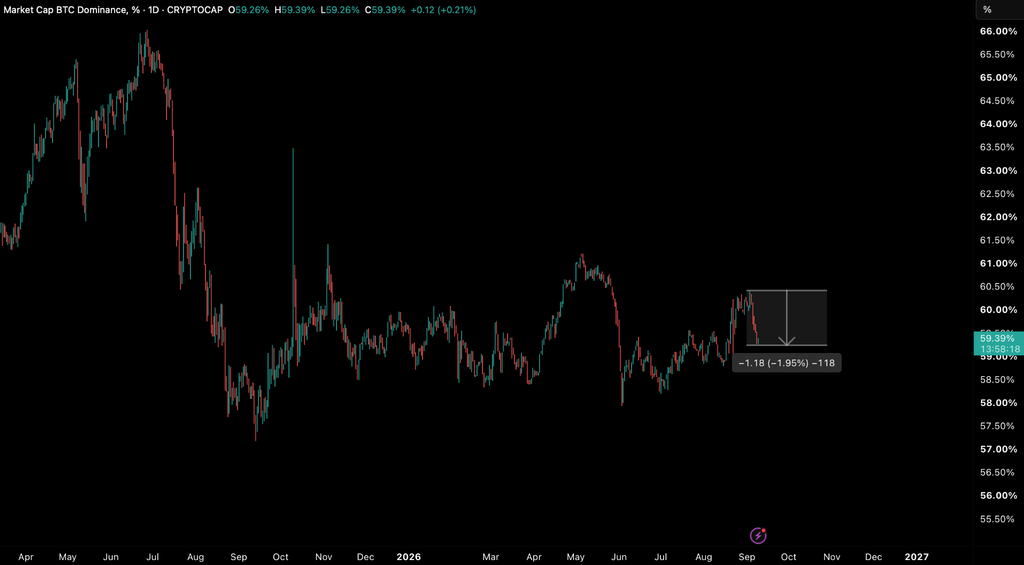
This reflects a return of risk appetite in the market, with the catalysts that propelled each altcoin higher. Zcash traded above $1,000 on Friday for the first time since it listed in 2016, two weeks after a spot Zcash ETF launched on 25 August and reached $500 million of assets, roughly $100 million of it from the sponsor’s parent company.
What the leaders share is the mechanism that operates whenever BTC ranges with funding at neutral: Leverage flows through into smaller assets post large BTC breakouts, as observed in mid August. This usually leads to altcoin outperformance and widespread speculation and is one of our essential criteria for “alt season”. Open Interest on altcoin perpetual contracts aggregated together overtook Bitcoin’s this week for the first time since December 2024.
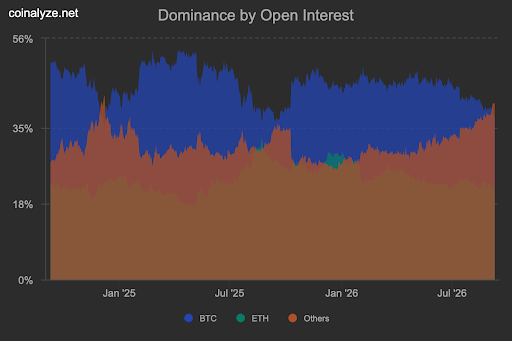
When these flips typically take place, either it marks a rotation with brief altcoin outperformance, followed by BTC taking the lead again after a consolidation range or a large potential pullback as leverage across the market heats up leading in a flush across the board. A case in point is in early December 2024, when altcoin open interest had just overtaken Bitcoin’s. On 9 December a sharp move in markets saw $1.7 billion of positions liquidated in a single day, 91 percent of them in altcoins, while BTC fell seven percent. The altcoin advance is therefore a leveraged bet that BTC’s range will hold rather than a move independent of it. This makes breadth a risk gauge rather than a reason to add: a session in which BTC falls below the range lows could lead to a similar outcome as December.
Roadmap and Our Stance
| Scenario | Activation | Path and target | Invalidation |
| A. Acceptance | Multiple closes above $81,300 with aggregate SOPR above 1.0 and green ETF prints | Shelf converts to support; expansion over the volume vacuum to the $86,500 high volume node | Rejection wick back below $81,300 shortly after breakout |
| B. Range (in force) | Closes between $77,100 and $81,300, , through CPI and the FOMC | Resolution comes from the 11 September print, the 16 September decision and the 25 September expiry | |
| C. Retrace | Breakdown below $77,100 | $73,500 (three-to-six-month cost basis), then the $70,956 short-term holder cost basis | Reclaim of the $77,100 lows with strong spot buying which would count as a range low deviation |
Our stance is constructive with range continuation signals continuing to flash while implied volatility gradually ticks up around macro catalysts leading to the possibility for a possible breakout.




Be the first to comment