


Ethereum price hovered near $2,468 on Sep. 10 as buyers defended the lower end of a multiweek range, while repeated failures above $2,500 kept the short-term outlook uncertain.
Summary
- Ethereum price traded near $2,468 after moving between approximately $2,455 and $2,485 during the session.
- The 4-hour chart places immediate support at $2,460 and resistance between $2,500 and $2,508.
- A weekly close above $2,550 could open the way toward $2,656 and $2,812.
- Liquidation clusters near $2,440 and $2,490 could increase volatility if either level breaks.
Ethereum price action today
According to data from crypto.news, Ethereum (ETH) price traded around $2,468 at the time of writing after briefly falling to approximately $2,455. The token remained below the psychological $2,500 level, which has repeatedly limited recovery attempts since late August.

The daily chart showed ETH holding inside a narrow range after its rapid August advance from below $1,900. Price has since struggled to extend that rally, with sellers appearing each time it approaches the $2,500 area.
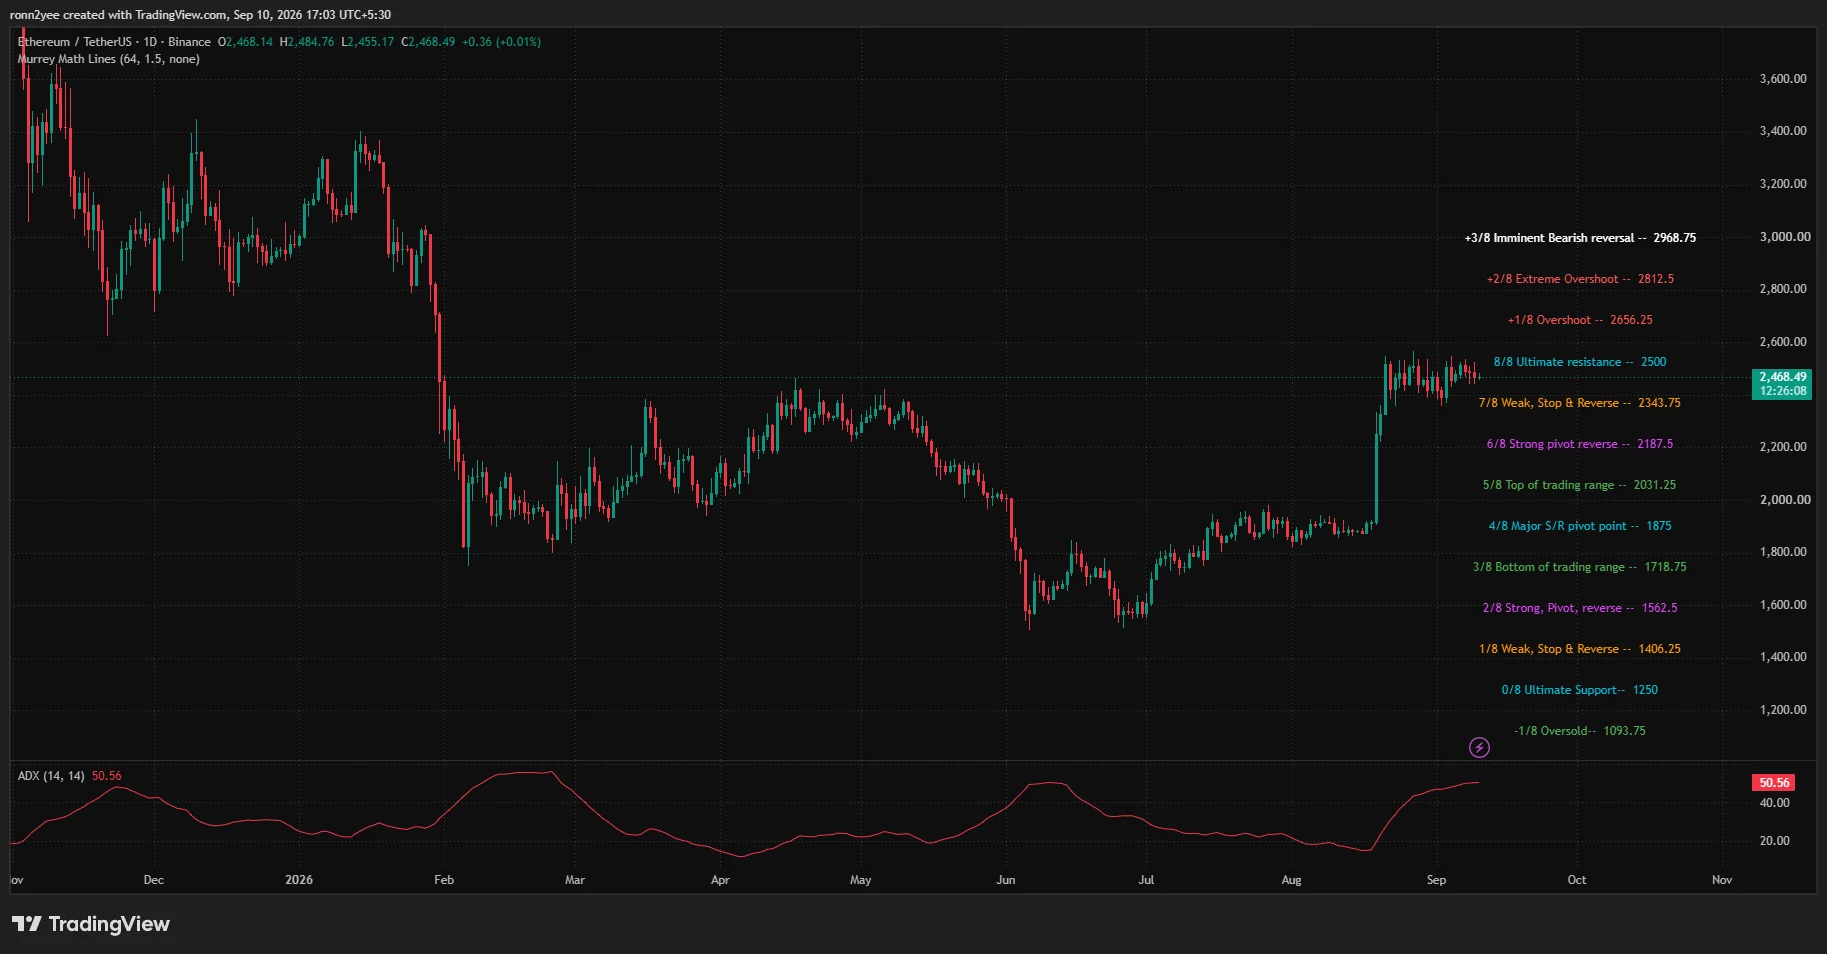
Ethereum’s latest daily candle opened at $2,468.14, reached a high of $2,484.76 and fell as low as $2,455.17. The small trading range showed that neither buyers nor sellers had established firm control during the session.
The broader structure remains stronger than it was before the August breakout. However, ETH is now testing the 8/8 Murray Math resistance at $2,500, making the level an important dividing line between continued consolidation and another upward move.
4-hour indicators show weak buying pressure
On the 4-hour chart, Ethereum traded at $2,469.40, below the Bollinger Bands’ middle line at $2,484.18. The upper band stood at $2,507.87, while the lower band was near $2,460.49.
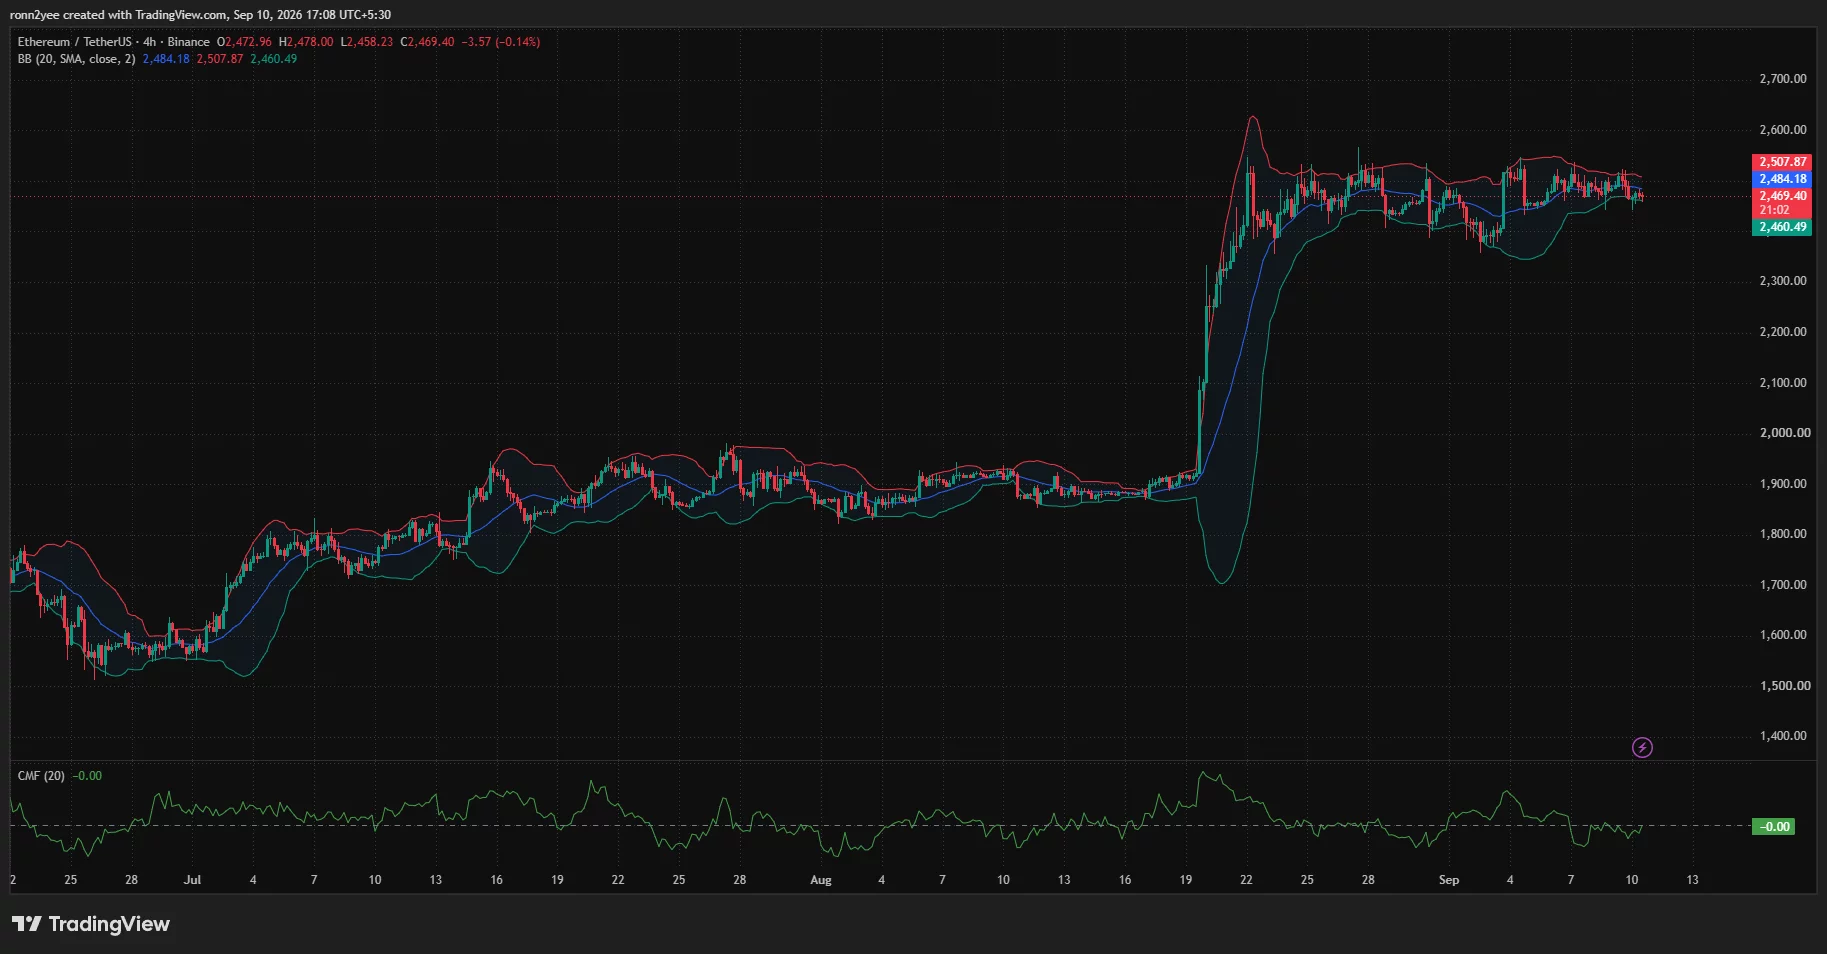
Price sitting close to the lower band showed that short-term selling pressure remained active. A close below $2,460 could push ETH toward the recent intraday low near $2,445, while a recovery above the middle band would return attention to the $2,500–$2,508 resistance zone.
The Chaikin Money Flow reading was near zero, showing no clear net inflow of capital on the 4-hour timeframe. The neutral reading matched the sideways price structure, with ETH moving between support and resistance without strong follow-through.
The daily Average Directional Index stood at 50.56. An ADX reading above 25 usually indicates a strong trend, but the indicator does not determine its direction. In Ethereum’s case, the elevated reading reflects the strength of the larger move that began in August, even as price consolidates beneath resistance.
Liquidation map places ETH between two liquidity zones
CoinGlass’ 24-hour Ethereum liquidation heatmap showed large concentrations of leveraged positions on both sides of the current price.
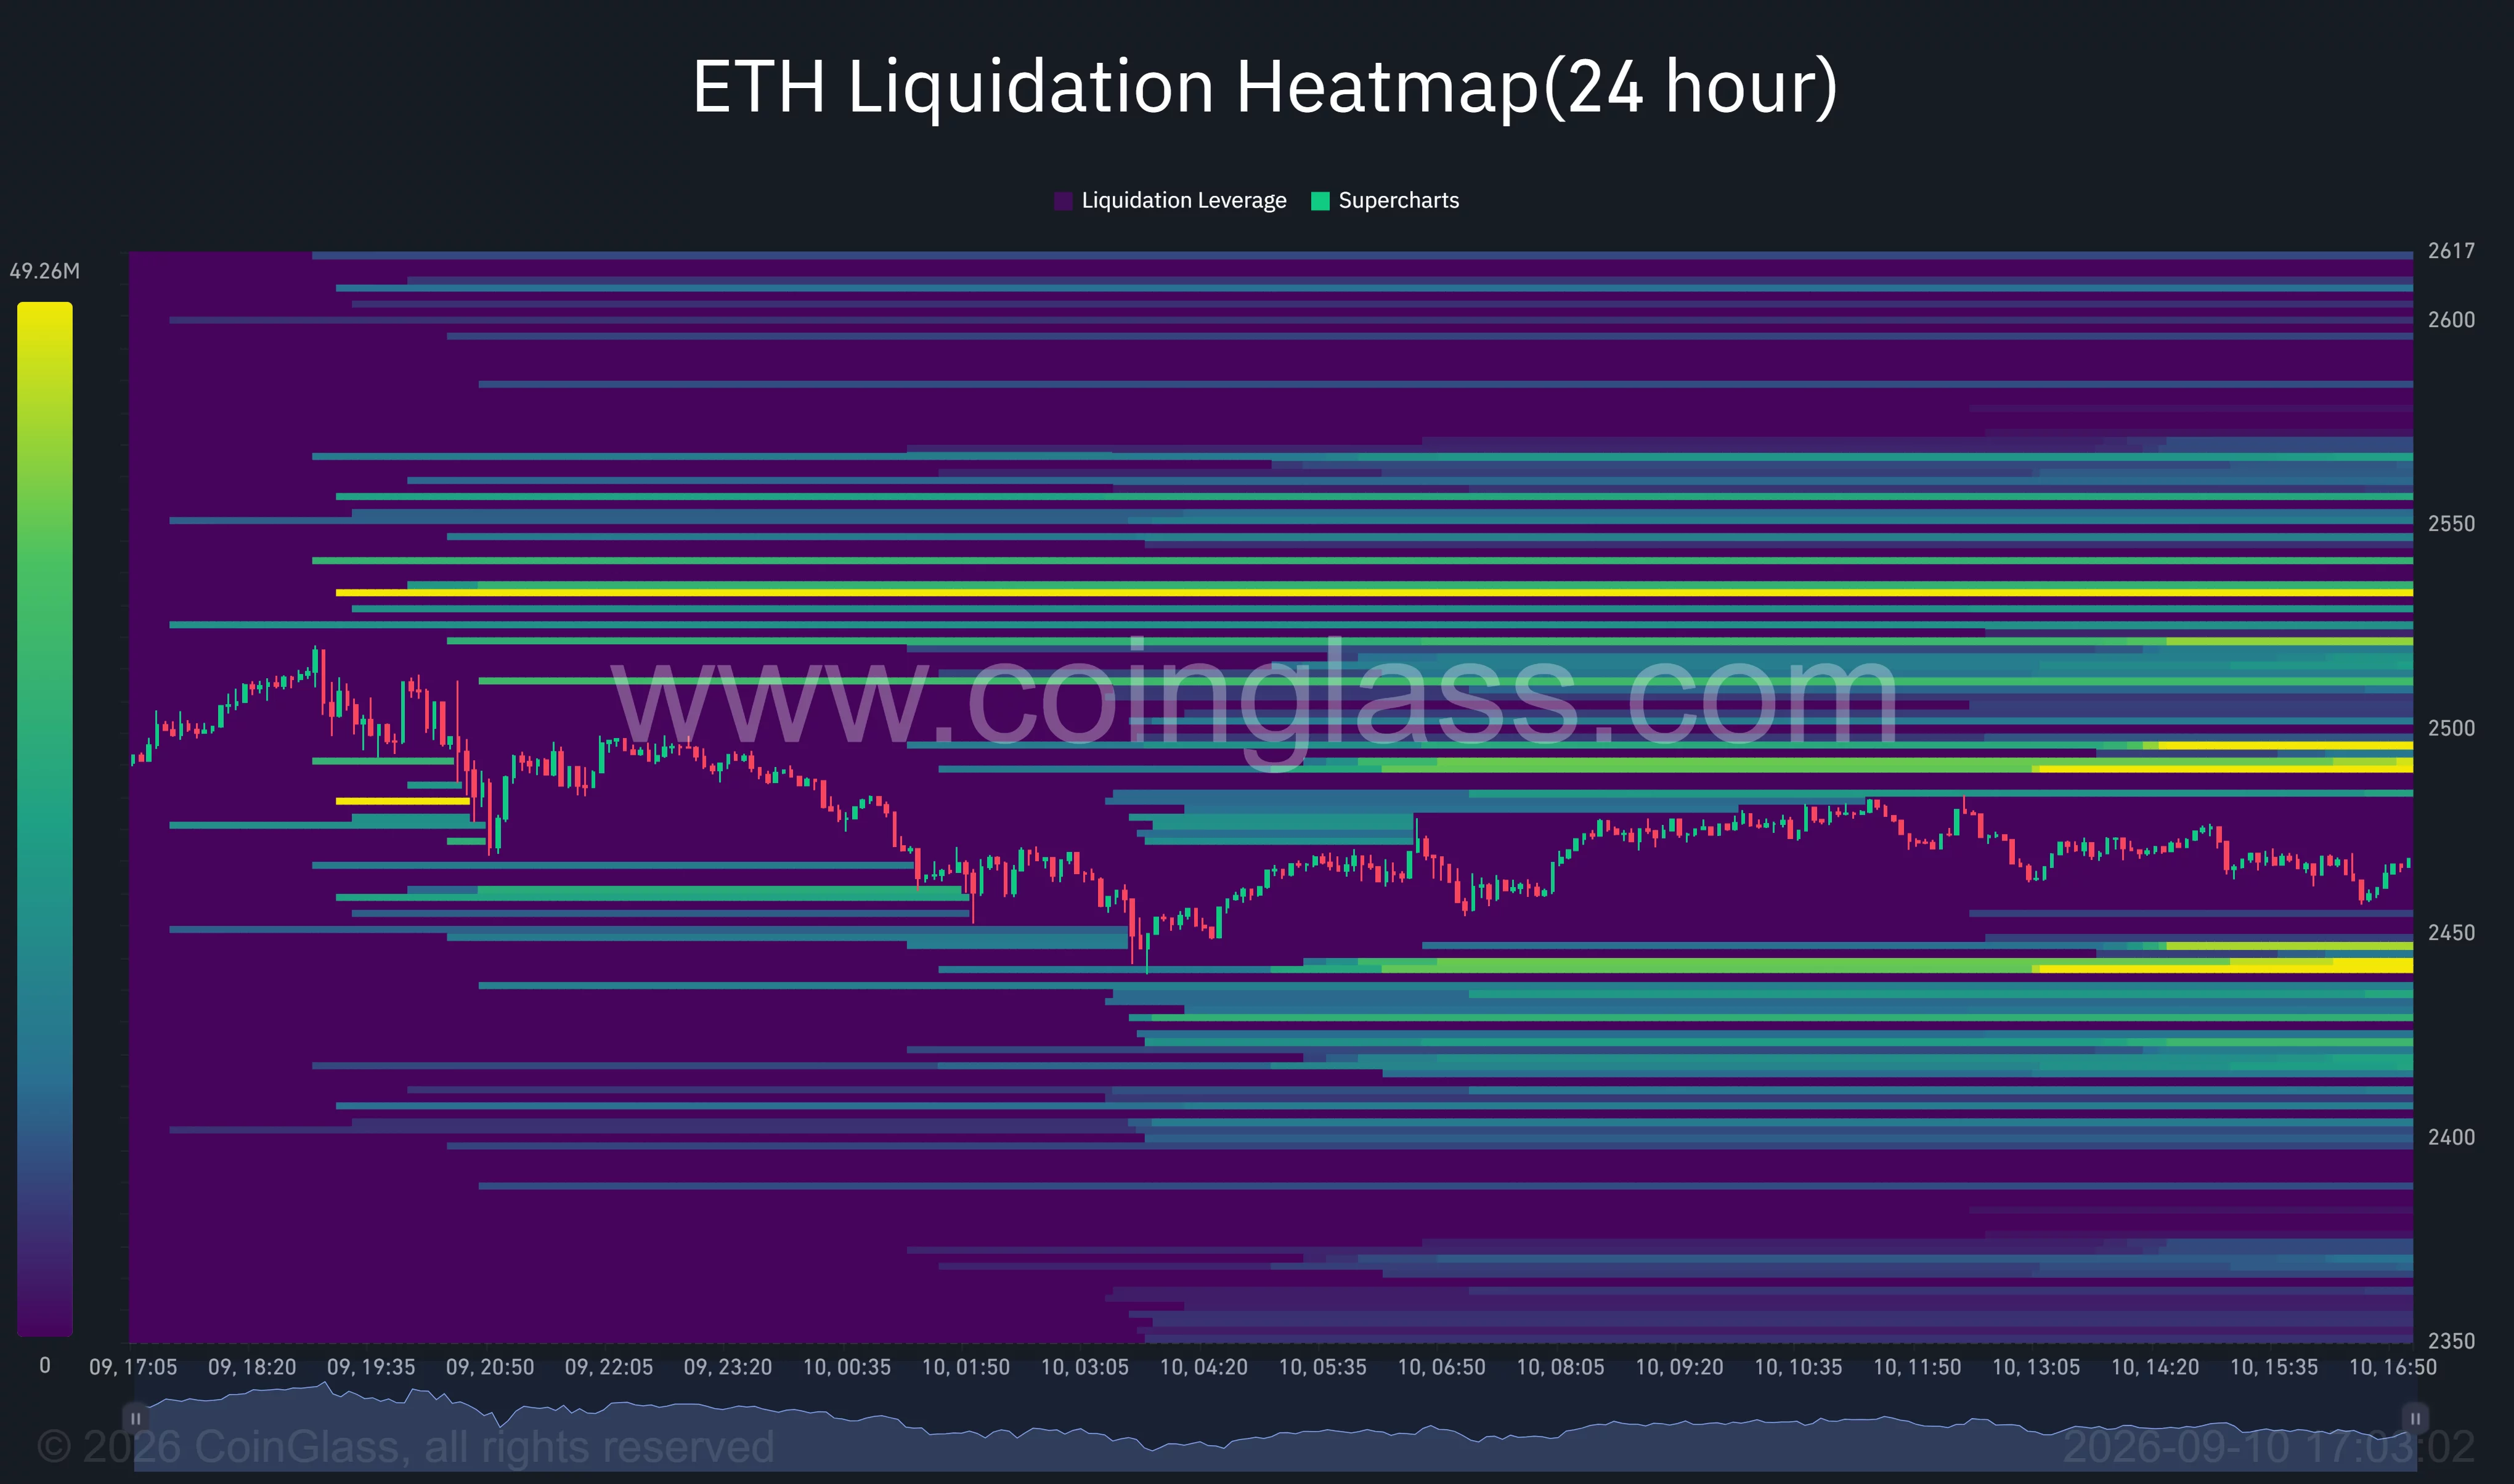
The nearest major liquidity cluster below ETH appeared around $2,440. Additional concentrations were visible between approximately $2,400 and $2,430. A break under $2,440 could force leveraged long positions to close and accelerate a move toward those lower bands.
Above the market, the largest nearby liquidation concentrations appeared around $2,490 and between $2,520 and $2,535. Liquidity was also visible near $2,550.
A rebound through $2,490 could therefore trigger short liquidations and pull Ethereum back toward $2,520. However, the number of liquidity bands on both sides of the price raises the risk of sharp moves within the existing range before ETH establishes a clear direction.
The liquidation heatmap also supports the short-term technical boundaries shown by the 4-hour Bollinger Bands. Both charts place Ethereum between support around $2,440–$2,460 and resistance beginning near $2,490.
Analysts identify $2,550 as the breakout level
Crypto trader Daan Crypto Trades said Ethereum had formed a tighter range than Bitcoin while sitting on support near $2,460. According to the analyst, neither bulls nor bears had strong momentum while both assets remained inside their respective ranges.
Daan added that a range break could lead to heavy liquidations among traders positioned on the wrong side. The heatmap supports that risk, with leveraged positions concentrated directly above and below Ethereum’s current market price.
Analyst Ted Pillows identified a wider range between $2,450 and $2,550. He said Ethereum would need a weekly close above $2,550 to begin another upward leg.
A confirmed move above $2,550 would place the next Murray Math target at $2,656.25. Further gains could expose $2,812.50, while the daily chart marks $2,968.75 as a higher resistance level.
The bearish scenario begins with a sustained break below $2,450. The next major daily level sits at $2,343.75, followed by stronger pivot support around $2,187.50. Ted’s weekly chart similarly identifies support near $2,215 if the current range fails.
US macro conditions could decide the range break
Ethereum’s compressed range comes ahead of the Federal Reserve’s Sep. 15–16 policy meeting. US interest-rate expectations remain important for ETH because higher yields can reduce demand for non-yielding risk assets, while a softer policy outlook can support speculative markets.
Until the Fed decision provides more clarity, Ethereum may remain sensitive to changes in Treasury yields, the US dollar and broader risk appetite. Derivatives positioning could amplify the reaction because large liquidation clusters sit close to both sides of the current price.
The immediate technical decision remains clear. Holding $2,440–$2,460 would preserve the range and allow another test of $2,500. Ethereum needs a weekly close above $2,550 to confirm stronger upside momentum, while a loss of $2,440 would shift attention toward $2,344 and $2,215.
Disclosure: This article does not represent investment advice. The content and materials featured on this page are for educational purposes only.


Be the first to comment